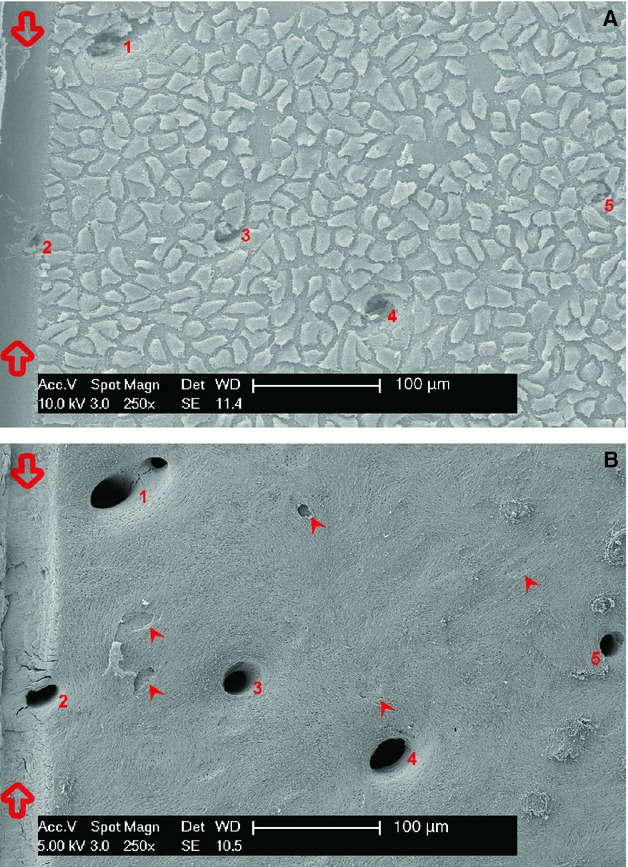
Figure 4.

(A) Scanning electron microscopy (SEM)/secondary electron imaging (SEI) (magnification 250×). The groove on the left (between empty arrows) corresponds to the border of the rectangular module used as reference for densitometry. The sheet of endosteal lining cells (osteoblasts) was exposed after marrow removal with cacodylate buffer irrigation. The cells are homogeneously distributed on the endosteal surface and are continuous with those lining the cortical vascular canals abutting the medullary canal (numbered from 1 to 5). Shrinkage led to the observed intercellular gap and floating cell boundaries. (B) SEM/SEI + OsO4 + K3[Fe(CN)6] (osmium tetraoxide and potassium ferrocyanide) (magnification 250×). The same field after maceration with osmium tetraoxide and potassium ferrocyanide shows the cortex vascular canals opening into the medullary canal (numbered 1 to 5). Osteocyte lacunae appear of different depth and correspond to a more or less advanced phase of osteocyte entrapment (arrowheads). The holes of the radial canalicula mark the boundary of the entrapping cell territory. Smaller canalicula holes are homogeneously distributed on the whole endosteal surface corresponding to the dendrites of full active osteoblasts (not committed to entrapment).
