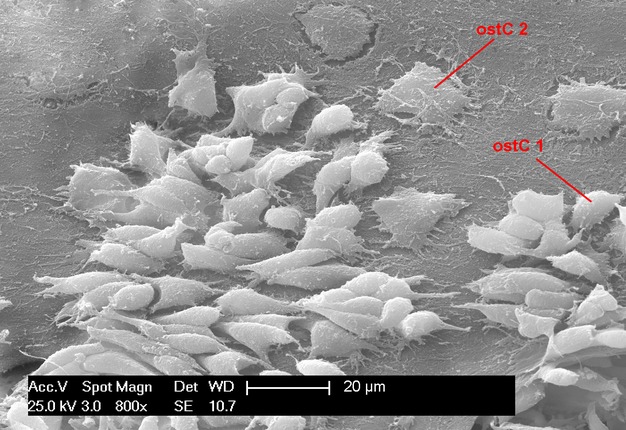
Figure 5.

SEM/SEI (magnification 800×). Endosteal surface of the right femur hemicortex, after ultrasonication treatment which mechanically detached a portion of lining cells. The lower cell surface density allowed observation of the relationship of cells and their membrane processes with the underlying bone substrate. The image illustrates the shape modulation that is undergone during entrapment. Osteoblasts of population C2 (ostC2) had a flattened bone surface and spread equatorial dendrites. The osteoblast population C1 (ostC1) showed reduced marginal adhesion to the bone, and the mean surface area was significantly lower than that of the C2 population. Different phases of entrapment are also evident in the top right and left corner, as well as the top middle of the figure.
