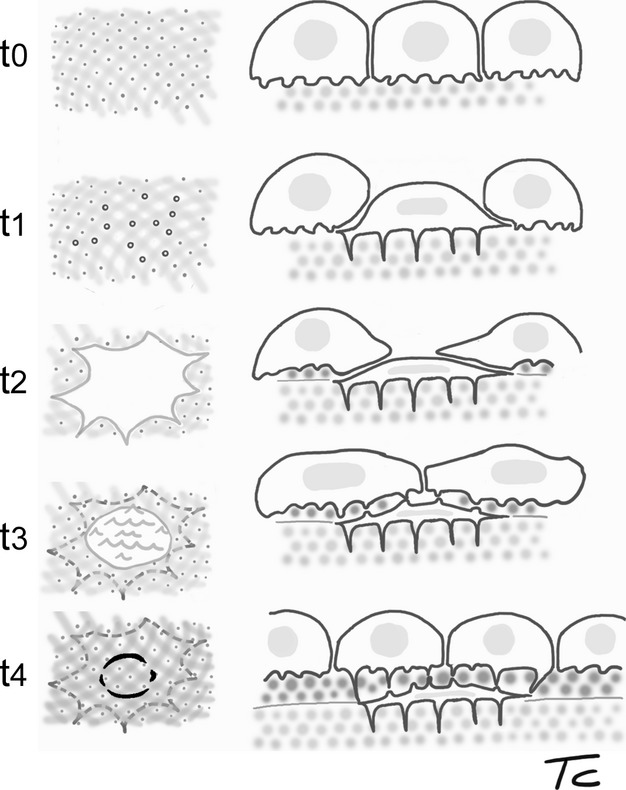
Figure 9.

Scheme illustrating the sequential steps of osteoblast-osteocyte transformation and cell entrapment, based on SEM surface observations from the current study. The left column shows the surface as seen from the top: sequential steps t0 and t1 correspond to osmium tetraoxide/ferrocyanide macerated surfaces, used to show the canalicula holes; t3 and t4 schematise the bone surface after removal of the osteoblast superficial layer. The dotted circles indicate the perimeters of entrapping or entrapped osteocytes. The right column represents the corresponding top to deep position of the cells with respect to the endosteal surface of the femur.
