
Figure 6.
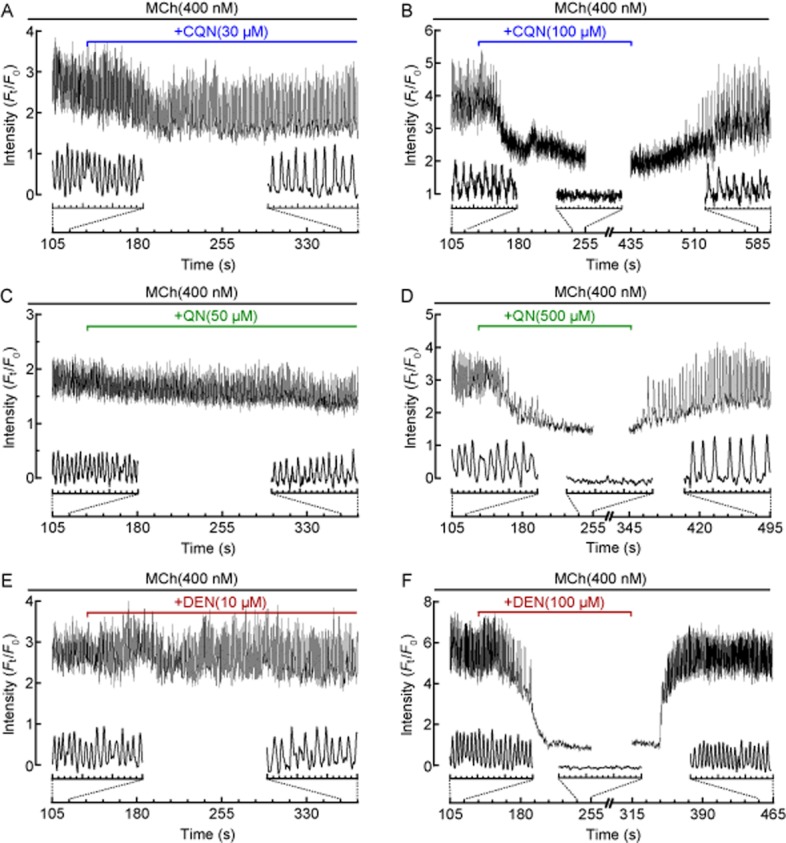
Effects of TAS2R10 agonists on MCh-induced Ca2+ oscillations in ASM cells. Representative traces showing intracellular Ca2+ signalling recorded in a single ASM cell contracted with 400 nM MCh in the absence and presence of (A, B) 30 and 100 μM chloroquine (CQN; from n = 12, 4 mice), (C, D) 50 and 500 μM quinine (QN; from n = 16, 4 mice) (E, F) 10 and 100 μM denotonium (DEN; from n = 8–13, 2 mice). Inset traces show details of Ca2+ oscillations or changes. Representative traces are expressed as intensity (Ft) normalized to the initial intensity at t = 0 s (F0), measured from a 10 × 10 pixel ROI of a single ASM cell.