
Figure 9.
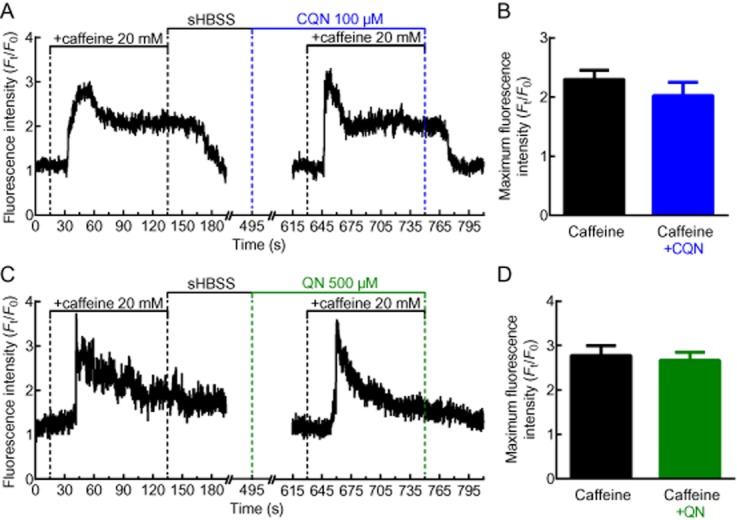
Effects of chloroquine and quinine on SR Ca2+ levels. The effect of (A) chloroquine (CQN) and (C) quinine (QN) on Ca2+ release from the SR store SR induced by caffeine. Left panel shows control response in the absence of (A) chloroquine or (C) QN. Representative traces, expressed as intensity (Ft) normalized to the initial intensity at t = 0 s (F0), measured from a 10 × 10 pixel ROI of a single ASM cell. (B, D) Summary of the maximum fluorescence intensity generated by caffeine alone or in the presence of (B) chloroquine (n = 16, 3 mice) or (D) quinine (n = 12, 3 mice). Each bar represents the mean ± SEM.