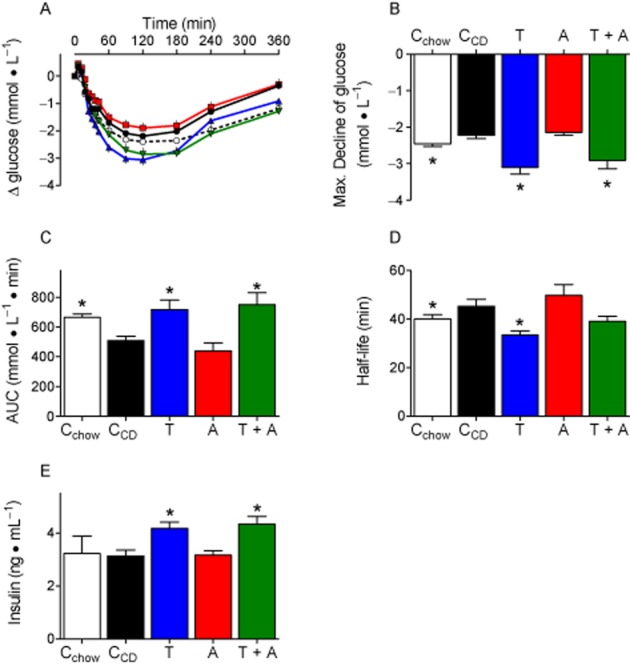
Figure 6.

Insulin response is impaired by CD feeding, but improved by telmisartan. A: Glucose plasma concentrations after insulin injections (0.6 IU insulin·kg−1, s.c.). B + C: The maximal glucose decrease (B) and the AUC (C) were lower in CCD than in Cchow, indicating impaired glucose utilization. Both parameters were improved by telmisartan (T) and telmisartan + amlodipine (T + A), but not byamlodipine (A). D: Half-life of glucose decline was quantified after ln transformation and determining slopes of regression lines. The fitting (R2) considering plasma values between 6 and 42 min was quite good and did not differ between groups (Cchow: 0.9436 ± 0.0099, CCD: 0.8293 ± 0.0247, telmisartan: 0.9288 ± 0.01449, amlodipine: 0.8457 ± 0.0268, telmisartan + amlodipine: 0.8658 ± 0.0406). Compared with CCD, glucose declined faster in telmisartan-, but not in telmisartan + amlodipine- (P = 0.0640) treated rats. E: Plasma insulin was controlled 24 min after insulin injections. Insulin concentrations were higher in telmisartan and telmisartan +amlodipine treated animals. Means ± SEM, n = 11–12, *P < 0.05 versus CCD.
