
FIGURE 4.
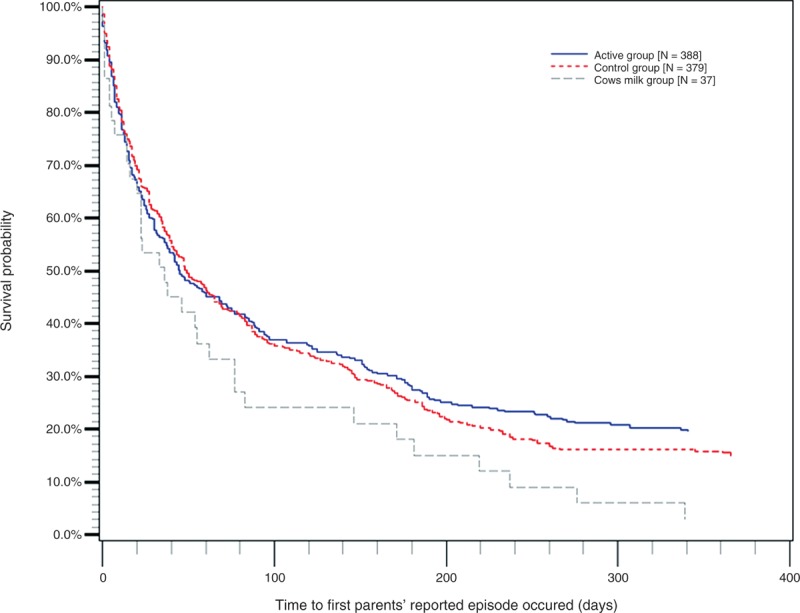
The Kaplan-Meier curve. Active, control, and cow's milk group: time to occurrence of first reported episode.
Official websites use .gov
A
.gov website belongs to an official
government organization in the United States.
Secure .gov websites use HTTPS
A lock (
) or https:// means you've safely
connected to the .gov website. Share sensitive
information only on official, secure websites.
The Kaplan-Meier curve. Active, control, and cow's milk group: time to occurrence of first reported episode.