
Figure 5. Pore-formation activity in black lipid bilayers.
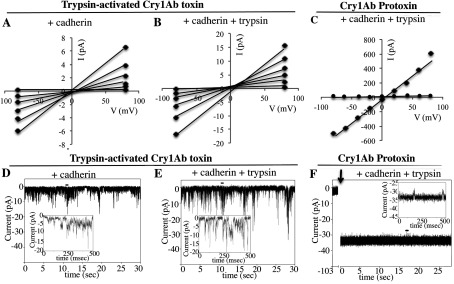
Current–voltage (I–V) relationship of the currents induced by activated Cry1Ab toxin (A and B) or Cry1Ab protoxin (C) after interaction with the cadherin fragment (A) or with cadherin fragment plus trypsin (B and C) and recovered in SUV liposomes as described in the Experimental section. Representative ionic pore records of most common transitions induced by these samples are shown in (D) and (E) for oligomers obtained from activated toxin (after incubation with cadherin or cadherin plus trypsin respectively) and (F) from Cry1Ab protoxin (after incubation with cadherin plus trypsin). Records were obtained in asymmetrical 300 mM cis and 150 mM trans KCl conditions. Insets in (D)–(F) each show a small portion of the recorded pores marked with a small horizontal line over the trace, on a millisecond timescale. Arrow in (F) indicates SUV liposome addition to the cis bilayer chamber. ◆, data after SUV addition; ●, data before SUV addition.