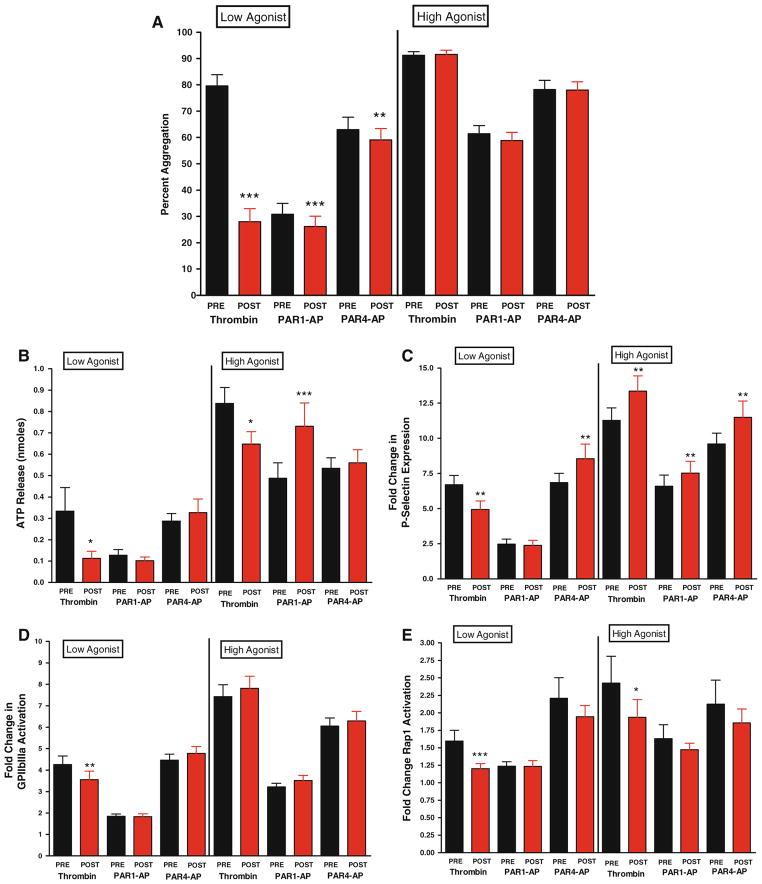
Fig 1.
Panel A bivalirudin effects on PAR-mediated platelet aggregation. Maximal platelet aggregation was measured following stimulation for 10 min with 2 nM thrombin (N = 40; ***P < 0.001), 2.5 μM PAR1-AP (N = 59; ***P < 0.001), or 100 μM PAR4-AP (N = 62; **P < 0.01). Maximal platelet aggregation following stimulation for 10 min with 10 nM thrombin (N = 63), 20 μM PAR1-AP (N = 64) or 200 μM PAR4-AP (N = 62). Panel B bivalirudin effects on dense granule secretion. Stimulation with thrombin at 2 nM (N = 15) or 10 nM (N = 39) resulted in a significant decrease of dense granule secretion (*P < 0.05). There was no significant shift in dense granule secretion following stimulation with low or high concentration PAR4-AP (N = 29 and 30 respectively) and low PAR1-AP (N = 39). There was augmentation with high PAR1-AP (N = 39, P = 0.0008) Panel C bivalirudin alters PAR-mediated alpha granule secretion. Composite fold change in mean fluorescence relative to unstimulated platelets for P-selectin following stimulation with 2 nM thrombin (N = 43; ** P < 0.001), 2.5 μM PAR1-AP (N = 59) or 100 μM PAR4-AP (N = 66; **P < 0.01). Composite fold change for P-selectin following stimulation with 10 nM thrombin (N = 65; **P < 0.005), 20 μM PAR1-AP (N = 66; **P < 0.01) or 200 μM PAR4-AP (N = 66; **P < 0.01). Panel D bivalirudin shifts sensitivity to PAR-mediated activation of glycoprotein IIbIIIa. Composite fold change in mean fluorescence relative to unstimulated platelets for glycoprotein IIbIIIa following stimulation with 2 nM thrombin (N = 43; **P < 0.001), 2.5 μM PAR1-AP (N = 59) or 100 μM PAR4-AP (N = 66). Composite fold change in mean fluorescence relative to unstimulated platelets for αIIbβ3 following stimulation with 10 nM thrombin (N = 65), 20 μM PAR1-AP (N = 66), or 200 μM PAR4-AP (N = 66). Panel E bivalirudin effects on Rap1 activation. Composite fold change in Rap1-GTP following stimulation with 2 nM thrombin (N = 32; ***P < 0.001), 2.5 μM PAR1-AP (N = 39), or 100 μM PAR4-AP (N = 45). Composite fold change in Rap1-GTP levels following stimulation with 10 nM thrombin (N = 46; *P < 0.05), 20 μM PAR1-AP (N = 46) or 200 μM PAR4-AP (N = 45)

