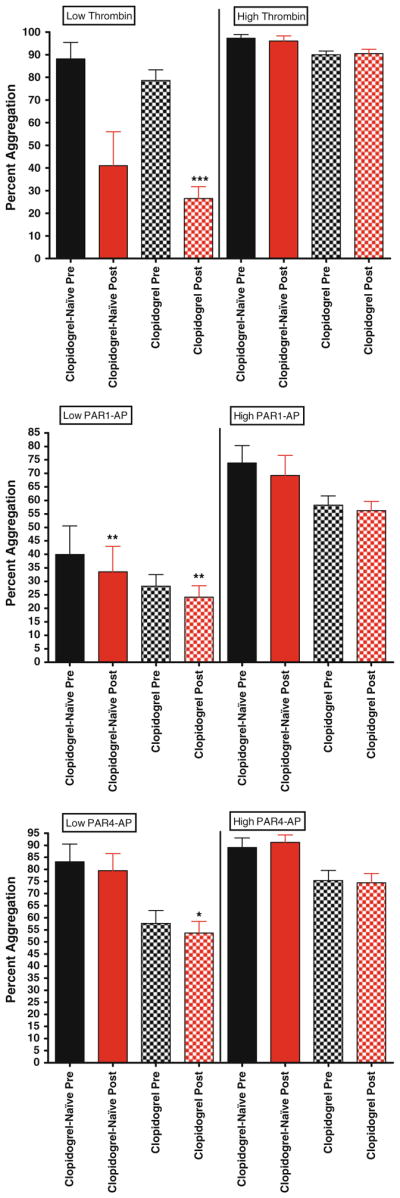
Fig 3.

Maximal Platelet aggregation in patients on clopidogrel versus clopidogrel naïve patients. For all graphs shown, black bars depict levels of percent aggregation before bivalirudin administration, while red bars depict levels of percent aggregation post bivalirudin administration. N = 51 for patients on clopidogrel, and n = 13 for clopidogrel-naïve patients. Top panel low and high dose thrombin stimulation. Middle panel low and high dose PAR1-AP stimulation. Bottom panel low and high dose PAR1-AP stimulation
