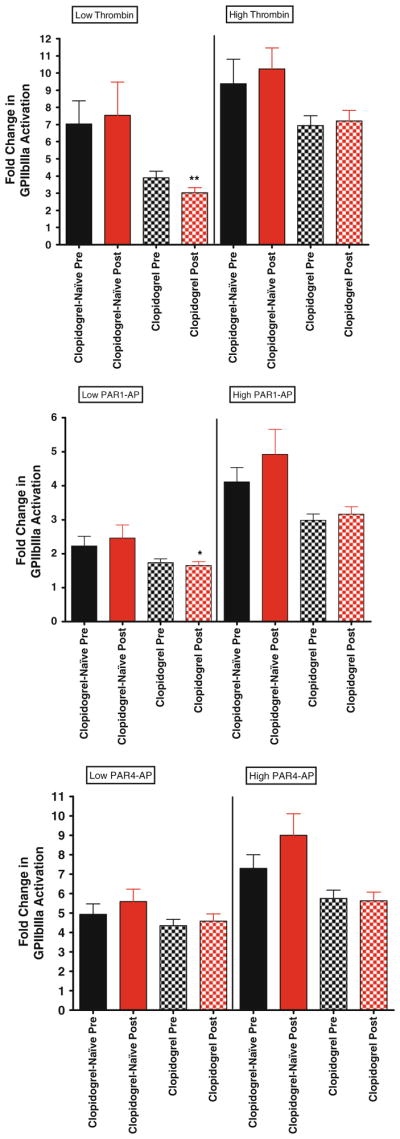
Fig 5.

Glycoprotein IIbIIIa expression in clopidogrel versus clopidogrel-naïve patients. For all graphs shown, black bars depict levels of activated glycoprotein IIbIIIa expression before bivalirudin administration, while red bars depict post bivalirudin P-selectin expression levels. N = 53 for patients on clopidogrel, and n = 13 for clopidogrel-naïve patients. Top panel low and high dose thrombin stimulation. Middle panel low and high dose PAR1-AP stimulation. Bottom panel low and high dose PAR1-AP stimulation
