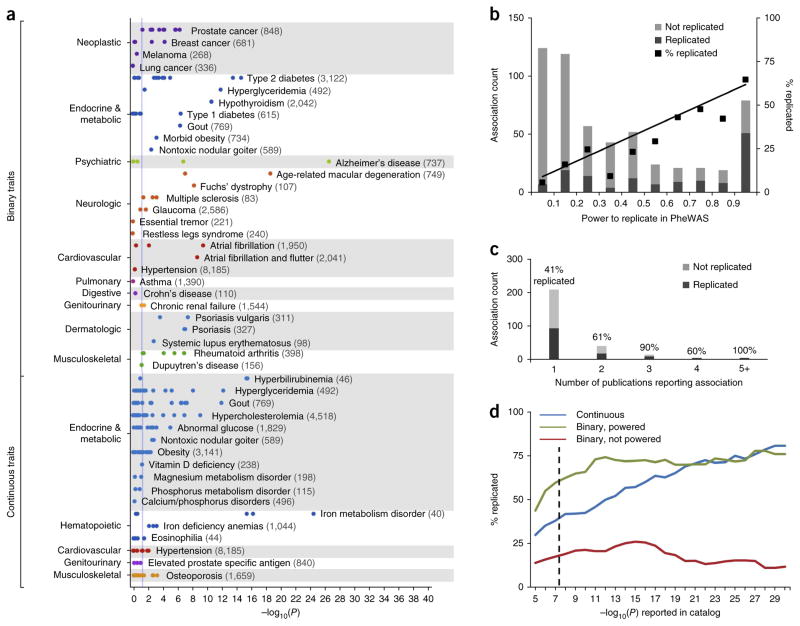
Figure 1.
PheWAS replication of NHGRI Catalog SNP-phenotype associations. (a) Each point represents the −log10(P) of a single SNP-phenotype association tested with PheWAS. This study is restricted to SNP-phenotype associations that achieved genome-wide significance (P ≤ 5 × 10⁻⁸) in at least one prior GWAS study that included individuals of European ancestry. Numbers in parentheses beside each phenotype represent the sample size within the PheWAS data set. The vertical blue line represents P = 0.05. Binary traits refer to all adequately powered, binary traits in the NHGRI Catalog with exact matches to a PheWAS phenotype. For example, 5/5 catalog SNPs associated with rheumatoid arthritis were replicated at P < 0.05 in PheWAS, and 9/15 SNPs associated with type 2 diabetes were replicated. Continuous traits are those numerically defined traits in the NHGRI Catalog that are related to PheWAS diseases (e.g., “iron deficiency anemia” was the PheWAS trait paired with the “serum iron level” catalog trait). (b) Replication rates of SNP-phenotype associations at different bins of statistical power. Association count refers to the number of SNP-phenotype associations replicated or not replicated at each bin of statistical power (e.g., all tested associations with power <0.1, power 0.1–0.2). The black line represents a linear regression weighted using the number of associations in each bin (y = 0.64×, r2 = 0.96). (c) Replication rate of NHGRI Catalog associations by number of unique publications citing the original SNP-phenotype association. Association count refers to the number of SNP-phenotype associations (among either adequately powered binary or continuous traits) with the corresponding number of publications. (d) Replication rate of NHGRI Catalog associations by discovery P-value. The dashed line indicates P = 5 × 10⁻⁸.

