
Figure 2.
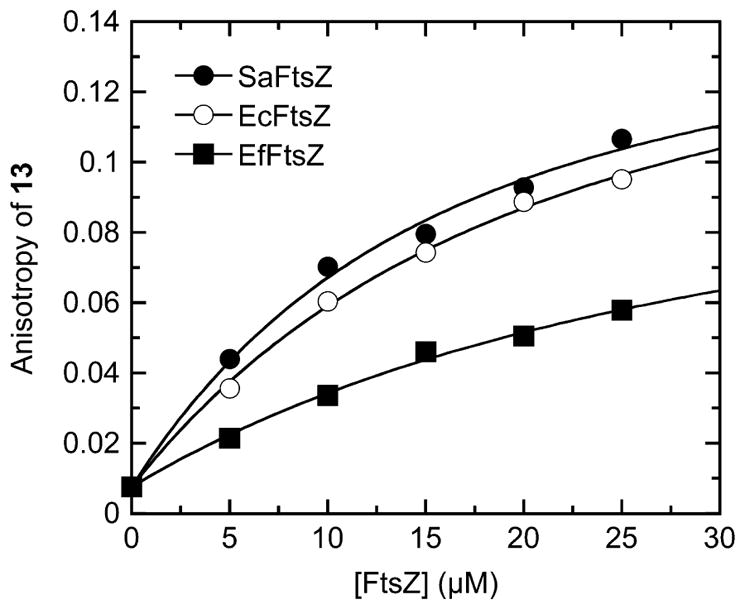
Fluorescence anisotropies of 5 μM 13 as a function of increasing concentrations of SaFtsZ (●), EcFtsZ (○), or EfFtsZ (■). The solid lines reflect the nonlinear least-squares fits of the data with eq 1. Experiments were conducted at 25 °C in solution containing 50 mM Tris·HCl (pH 7.4), 50 mM KCl, and 2 mM magnesium acetate.