
Figure 5.
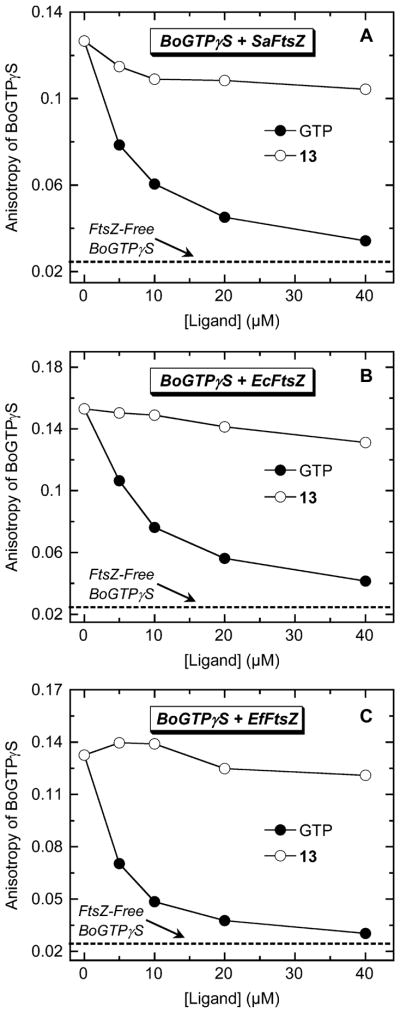
Fluorescence anisotropies of SaFtsZ-bound (A), EcFtsZ-bound (B), and EfFtsZ-bound (C) BoGTPγS (1 μM BoGTPγS, 5 μM FtsZ) as a function of increasing concentrations of nonfluorescent unlabeled GTP (●) or 13 (○). The dashed line represents the anisotropy value of 1 μM BoGTPγS in the absence of FtsZ (FtsZ-free BoGTPγS). Experimental conditions were as described in the legend to Figure 2.