
Figure 6.
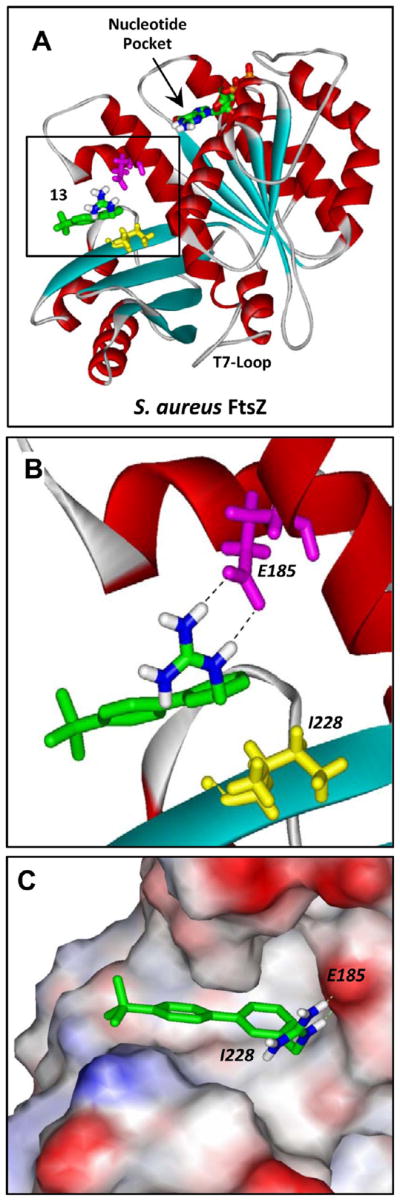
Structural homology model of SaFtsZ in complex with 13 derived as detailed in Experimental Section. (A) SaFtsZ is schematically depicted according to its secondary structural elements (α-helices in red, β-strands in cyan, and loops in gray), with the GTP binding pocket and T7 loop (which is involved in nucleotide hydrolysis when the proteins are polymerized) indicated. The 13–FtsZ complex shown reflects the highest scoring complex obtained using the Autodock Vina molecular docking program. The E185 and I228 residues of the protein are indicated in magenta and yellow, respectively. 13 and the bound nucleotide are depicted as a stick models and color coded by atom (carbon in green, nitrogen in blue, oxygen in red, phosphorus in orange, and hydrogen in white). (B, C) Expanded views of 13 bound to SaFtsZ. In panel B, the dashed lines reflect hydrogen bonds between the basic guanidinomethyl functionality of the compound and the acidic side chain of E185. In panel C, the protein is depicted in its solvent-accessible surface and color coded according to its electrostatic potential (blue for positive, red for negative, and white for neutral).