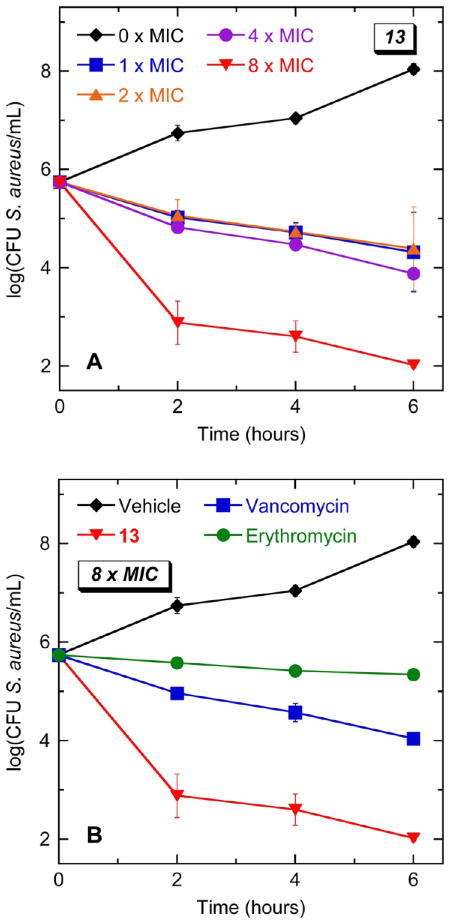
Figure 9.
Time–kill curves for S. aureus 8325-4 (MSSA). Each data point reflects the average of two independent measurements, with the error bars reflecting the standard deviation from the mean. (A) Bacteria were treated with vehicle (DMSO) only or 13 at concentrations ranging from 1 to 8 × MIC (1 to 8 μg/mL). (B) Bacteria were treated with vehicle only, 13, vancomycin, or erythromycin. When present, all agents were used at a concentration corresponding to 8 × MIC.

