
Fig. 2.
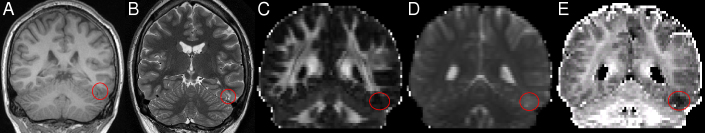
Left inferior temporal gyrus FCD. Patient 2: the FCD is poorly defined on structural images including volumetric T1-weighted (A) and T2-weighted PROPELLER (B) and standard DTI images including FA (C) and MD (D) but easily visible as reduced ICVF (E).