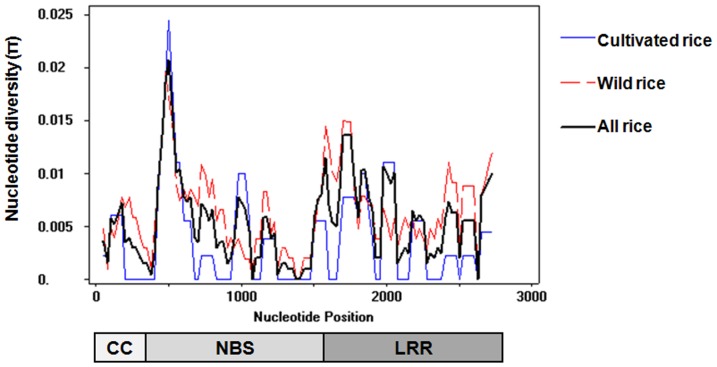
Figure 1. Sliding-window analysis of diversities in Pid3 coding region.
The nucleotide diversity (π; Y-axis) was generated by DNAsp5.0, and the X-axis represents the positions of nucleotides. The blue line stands for the result of cultivated rice varieties; the red line stands for the wild rice, and the black line stands for all rice. The map below the sliding window is the encoding structure of the Pid3 gene, the shaded box denotes the exon region, and CC, NBS, LRR region are marked on its corresponding region.

