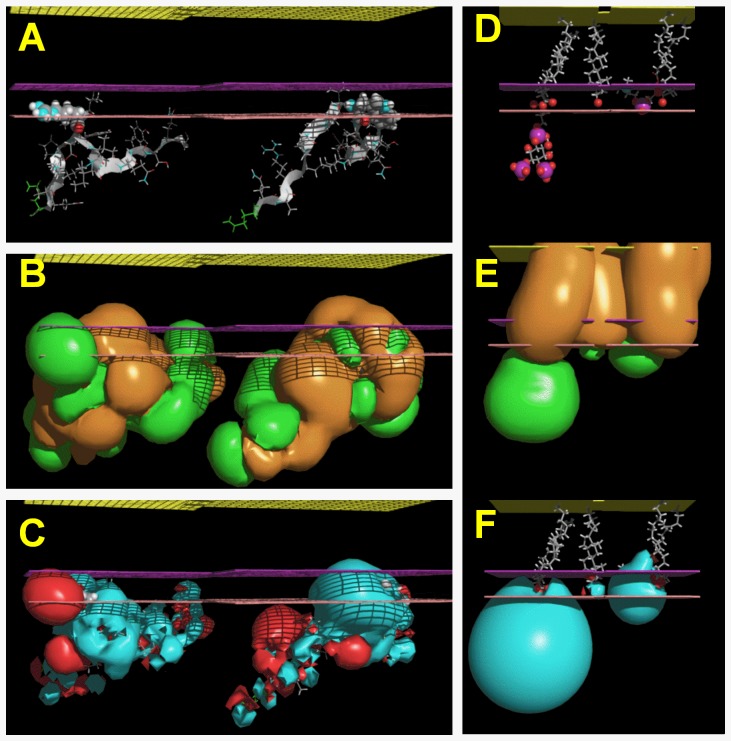
Figure 7. Relative position of a series of molecules in the membrane.
All molecules are shown at their optimal position in the IMPALA slab after they were systematically tested at every Å across a water/membrane continuous layer. In all plots, the yellow grid represents the membrane center; the purple grid, the averaged lipid head/acyl chain interface, and the pink grid the averaged lipid/water interface. A, PepLook model of the WT (left) and R539W (right) peptides. In both cases, residue 539 is imbedded in the membrane. B, MHP (Molecular Hydrophobicity Potential) profiles of fragments. R539 is responsible for a large hydrophilic (green) protuberance, whereas W539 is a hydrophobic (brown) protuberance in the membrane. C, MEP (molecular electrostatic profile) of the same molecules showing the e-attractivity of the R539 protuberance. D, E and F, same as in A, B and C except that molecules are, from left to right, an extended fluid form of PIP2, cholesterol, and a fluid form of DOPC. They highlight the relative position of PIP2 and peptides and the fact that the more hydrophobic cholesterol is embedded in the membranes.

