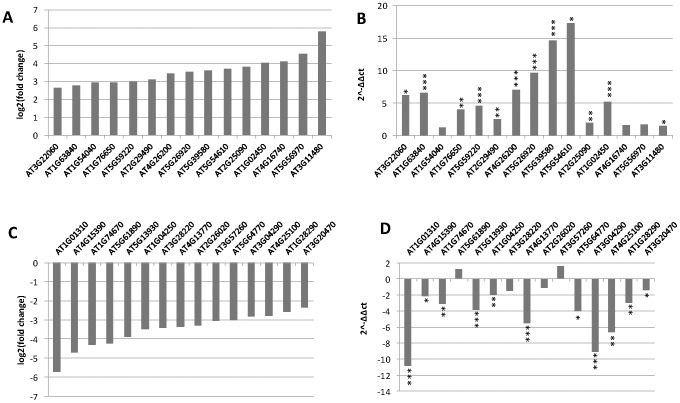
Figure 2. qRT-PCR analysis confirming overall results of RNA-seq experiments.
The fold changes in transcript levels identified in RNA-seq experiments for 15 selected genes are graphed in A (up-regulated) and C (down-regulated). qRT-PCR was performed using the same samples for RNA-seq experiments with primers for the selected genes showing up-regulated (B) or down-regulated (D) by 1 mM melatonin. All q-RT-PCR were repeated four times. * p<0.05, ** p<0.01, ***p<0.001.

