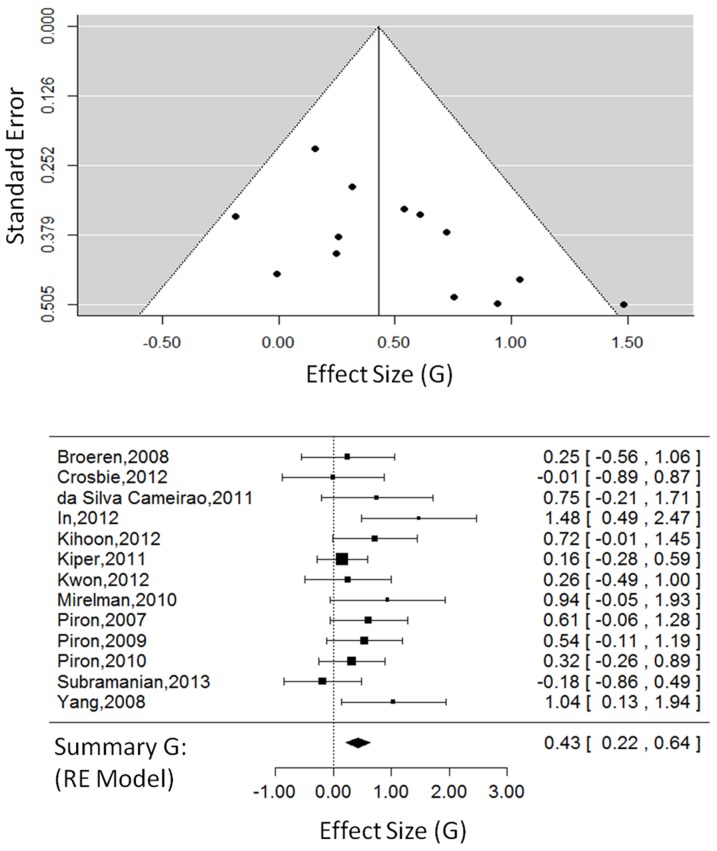
Figure 2. Body function outcomes in VE studies.
The funnel plot (top) for body function outcomes showing effect-sizes (G) as a function of precision (standard error) in each virtual environment study. The forest plot (bottom) showing the effect-sizes and 95% confidence intervals for each study and the summary effect-size from the random-effects model. Positive values show a difference in favour of VE therapy. Negative values show a difference in favour of CT. Abbreviations: VE, virtual environments; RE, random effects.

