
Figure 1.
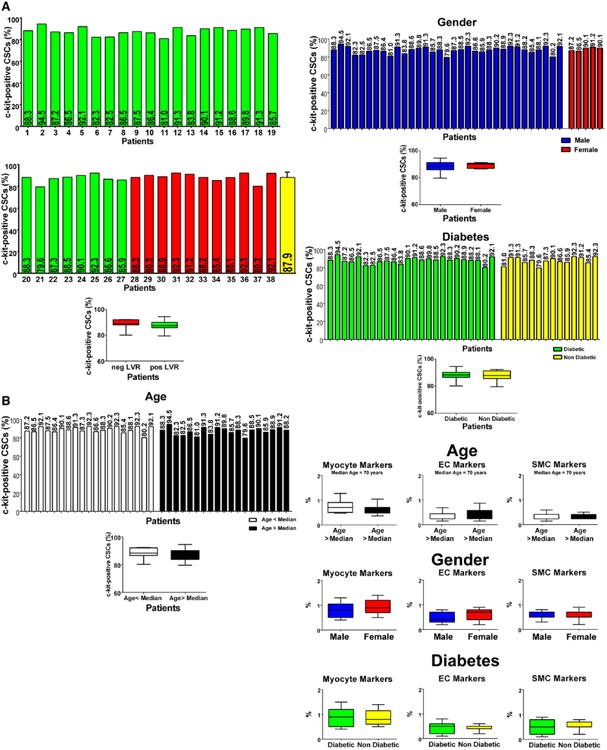
Phenotype of CSCs. A, Percentage of c-kit–positive CSCs in each of the 38 preparations. Patients 1 to 27 (color-coded green) experienced positive LVR; patients 28 to 38 (color-coded red) experienced negative LVR. B, Effects of age, sex, and diabetes mellitus on c-kit–positive CSCs and the expression of lineage markers. Data are shown by box plots: the box represents the interquartile range, the horizontal line inside the box marks the median, and whiskers show 5 to 95 percentiles range. CSC indicates cardiac stem cell; EC, endothelial cell; LVR, left ventricular remodeling; and SMC, smooth muscle cell.