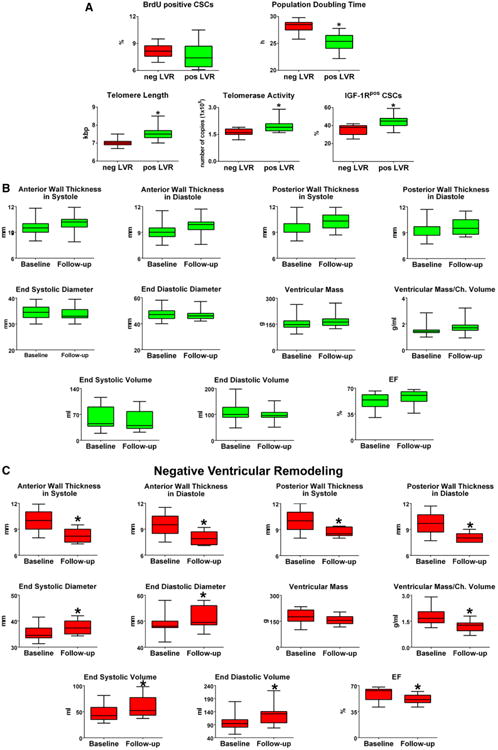
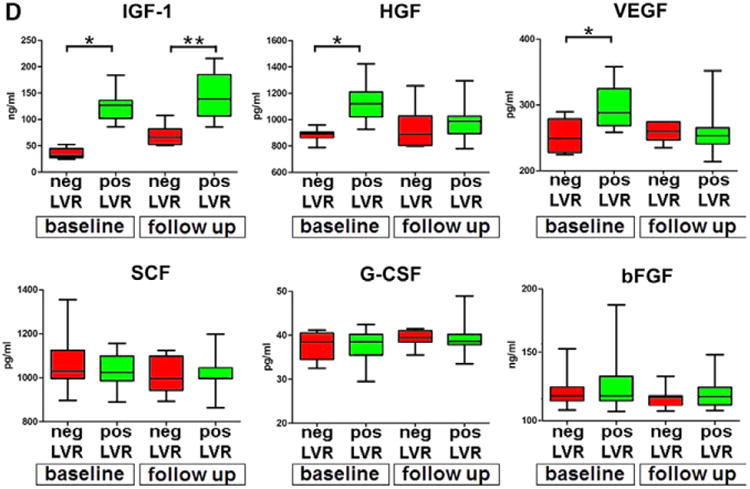
Figure 6.


CSCs, growth factors, and LVR. A through C, Data are shown by box plots: the box represents the interquartile range, the horizontal line inside the box marks the median, and whiskers show 5 to 95 percentiles. *Indicates P<0.05 vs negative (neg) LV remodeling (A, LVR) or baseline (B and C). Shorter population-doubling time, longer telomeres, and indices of wall thickening, decreased chamber size, and increased myocardial mass were coupled with positive LVR. D, Serum levels of IGF-1, HGF, VEGF, SCF, G-CSF, and bFGF at baseline and follow-up. The increase in IGF-1 was associated with positive LVR. The quantity of each growth factor in patients with positive (pos) and negative (neg) LVR is shown as mean±SD. *P<0.05 vs baseline values in patients who underwent neg LVR at follow-up; **P<0.05 vs follow-up values in patients who underwent neg LVR. bFGF indicates basic fibroblast growth factor; BrdU, bromodeoxyuridine; CSC, cardiac stem cell; G-CSF, granulocyte-colony stimulating factor; HGF, hepatocyte growth factor; IGF-1, insulin-like growth factor-1; IGF-1R, insulin-like growth factor-1 receptor; LVR, left ventricular remodeling; SCF, stem cell factor; SD, standard deviation; and VEGF, vascular endothelial growth factor.
