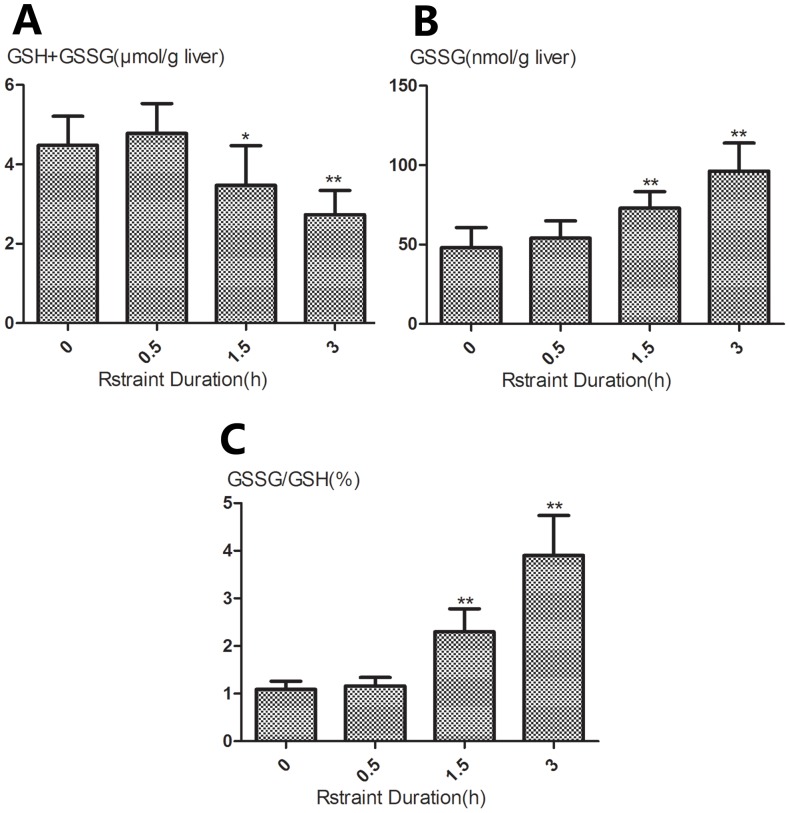
Figure 2. Changes in hepatic glutathione content in mice subjected to restraint stress in varying time periods.
Liver content of total glutathione (GSH+GSSG) (A), GSSG (B) and the GSSG-to-GSH ratio (C) were measured at the indicated time points. Results are expressed as means±SD. There are 5 animals per group. Significance of the differences vs unrestraint animals is given by * p<0.05, ** p<0.01.

