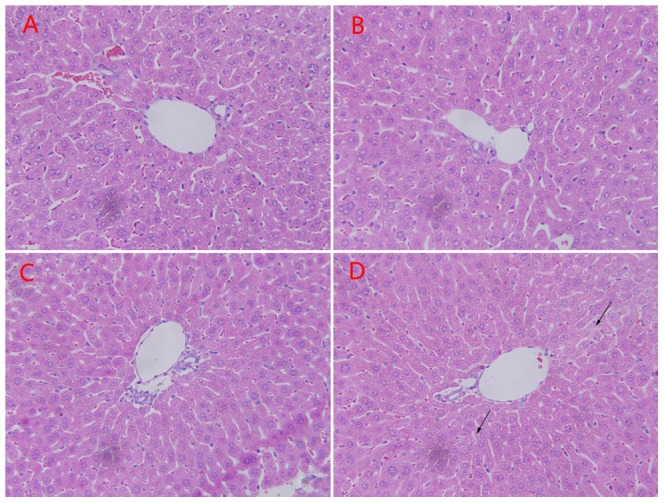
Figure 3. Hepatic histopathology in mice subjected to restraint stress in varying time periods.

Light photomicrographs of liver sections were obtained from control mice (A), and mice exposed to 0.5 h (B), 1.5 h (C), 3 h (D) restraint stress. Most of the liver parenchyma had normal appearance either after 0.5 h or 1.5 h restraint. Only mice subjected to 3 h restraint showed slight cytoplasmic relaxation (black arrows). Magnification×400.
