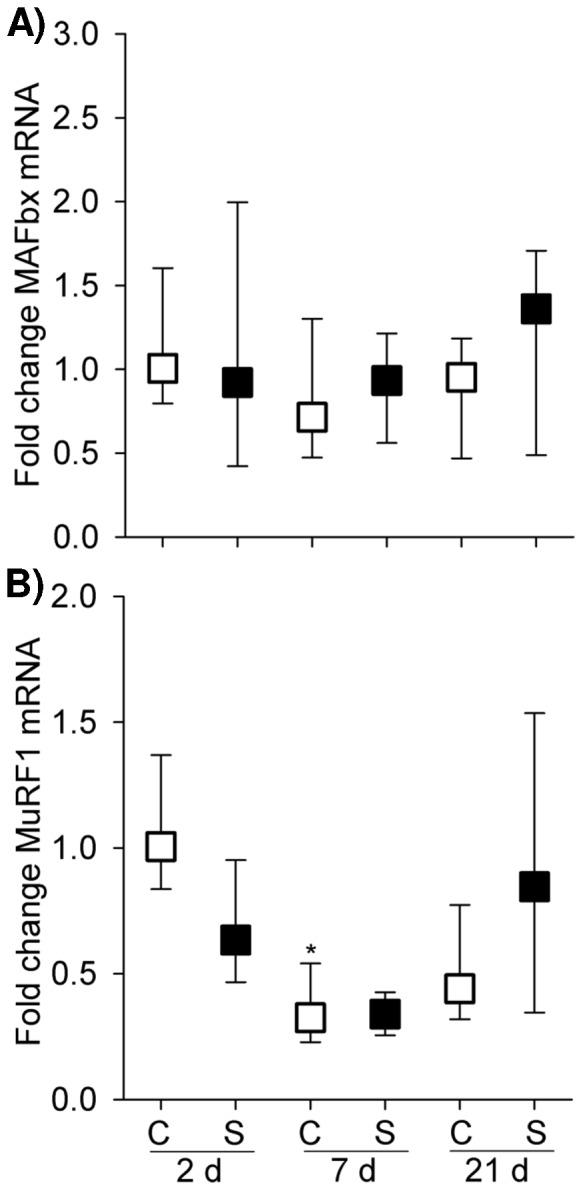
Figure 7. Atrophic Gene Expression.

Graphs show MAFbx and MuRF1 mRNA level in the controls and maternal steroid treatment groups of 2(n = 4 for control, n = 8 for steroid group), 7 d (n = 7 for control, n = 4 for steroid group) and 21 d (n = 5 for both control and steroid groups) postnatal age. Values are Median (25th, 75th centile), expressed as fold change relative to 2 d control group. White and black box plots refer to the control and steroid treatment groups respectively. * indicates p<0.05 compared with controls of 2 d. C: control; S: steroid.
