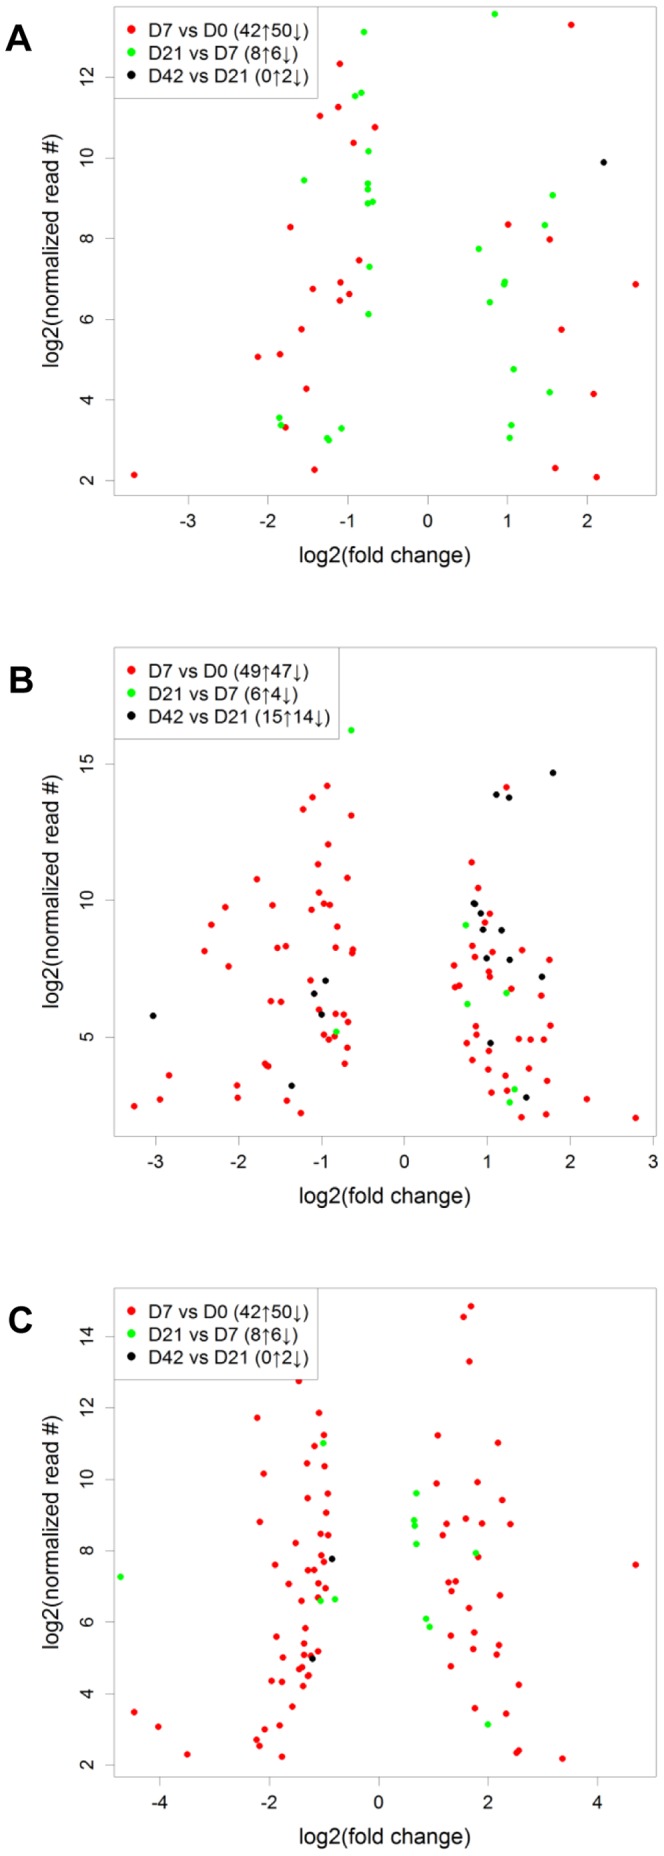
Figure 3. Detected temporally DE miRNAs based on comparisons D7 vs. D0 (red), D21 vs. D7 (green), and D42 vs. D21 (black).

The X and Y axes show log2 (fold change) and log2 (normalised reads number) of each DE miRNA, respectively. (A). DE miRNAs detected in rumen (RU) tissue. (B). DE miRNAs identified in tissue collected from mid-jejunum (MJ). (C). DE miRNAs detected in tissue collected from from ileum (IL). “↑”: the number of up-regulated miRNAs; “↓”: the number of down-regulated miRNA.
