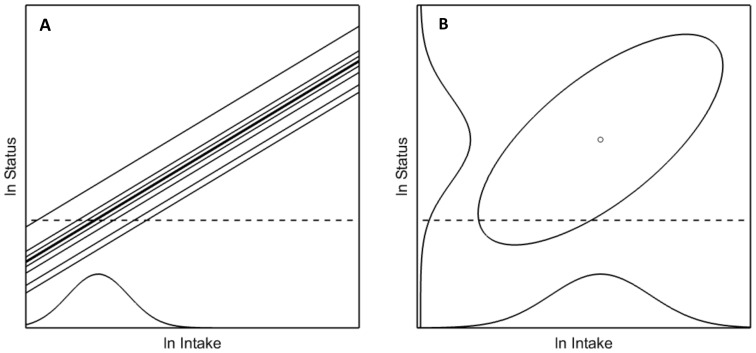
Figure 1. Ln status vs. ln intake.
(A) Model of parallel individual regression lines defines the distribution of nutrient requirements. The health-related cut-off value for ln status is depicted by the horizontal dotted line. The intersection of the parallel dose-response lines with the cut-off value defines the requirements distribution, as shown along the ln Intake axis. (B) The intake-status model shows a bivariate normal distribution representing ln intake and ln status in a population of individuals. Marginal intake and status distributions are shown along the respective axes.

