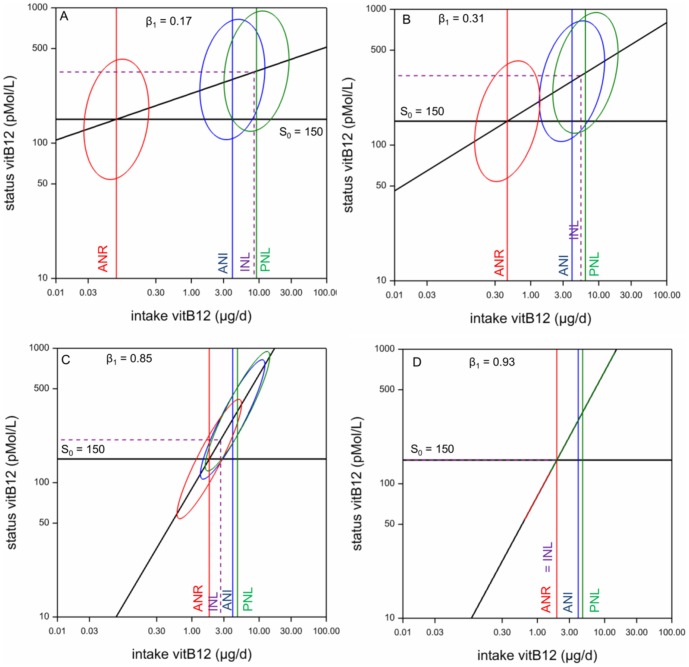
Figure 3. Deriving nutrient intake values for vitamin B-12 from the bivariate lognormal model.
Four models (A–D, see Table 2) of using the dose-response relation (sloping line) and estimated current distribution around the Average Nutrient Intake ANI (blue ellipse) for estimating the Average Nutrient Requirement ANR (50% below line S0 = 150, red ellipse), the Individual Nutrient Level INL (2.5% of requirements distribution above purple vertical line) and the Population Nutrient Level PNL (2.5% below line S0 = 150, green ellipse).

