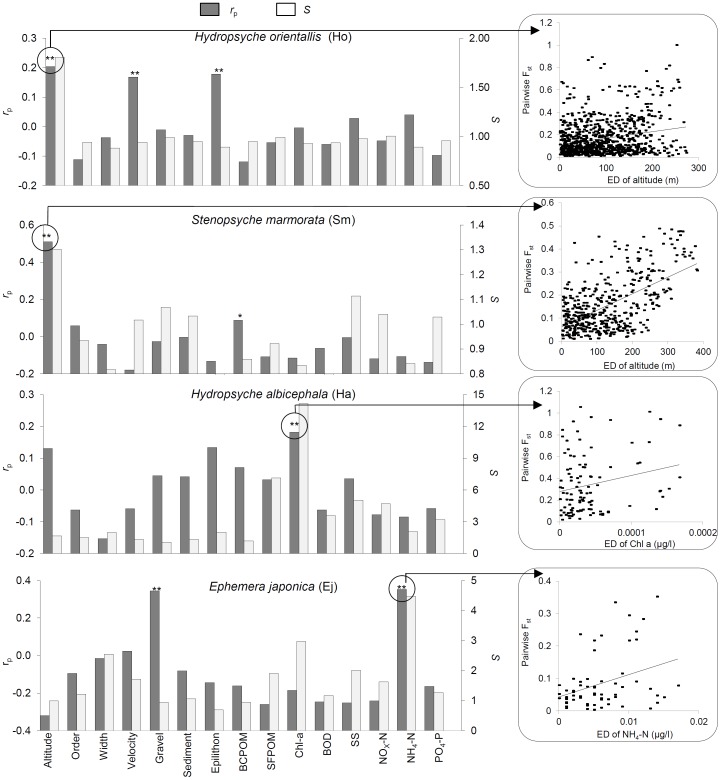
Figure 2. Specialization index (open bars) and genetic-environment correlation coefficients at outlier loci (filled bars) for each species and each environmental variable.
Partial Mantel tests were used to calculate r p in order to control for any effect of geographic distance. ** = significant partial Mantel correlation (p<0.001, randomizations test). In each species, highest r p and highest S occurred with the same environmental variable. These were altitude (Ho, Sm), transported chlorophyll-a (Ha), and ammonium-nitrogen (Ej). Correlations with highest rp are shown in the right-hand panels.

