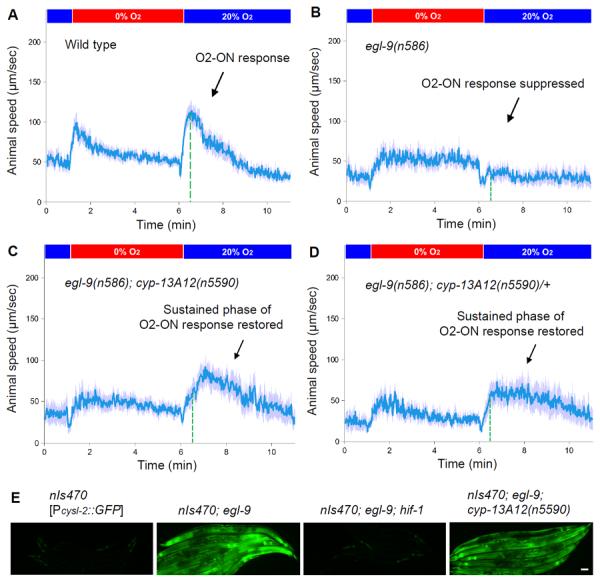
Fig. 1. n5590 suppresses the defect of egl-9 mutants in the O2-ON response.

(A) Speed graph of wild-type animals, showing a normal O2-ON response. Average speed values ± 2 SEMs (blue) of animals (n > 50) are shown with step changes of O2 between 20% and 0% at the indicated times. The mean speed within 0–120 s after O2 restoration is increased compared with that before O2 restoration (p < 0.01, one-sided unpaired t-test). The dashed green line indicates the approximate boundary (30s post-reoxygenation) between the initial and sustained phases of the O2-ON response. (B) Speed graph of egl-9(n586) mutants, showing a defective O2-ON response. (C) Speed graph of egl-9(n586); cyp-13A12(n5590) mutants, showing a restored O2-ON response mainly in the sustained phase (right of the dashed green line). The mean speed within 30–120 s after O2 restoration was significantly higher than that of egl-9(n586) mutants (p <0.01). (D) Speed graph of egl-9(n586); cyp-13A12(n5590)/+ mutants, showing a restored O2-ON response in the sustained phase. (E) hif-1 but not cyp-13A12(n5590) suppressed the expression of cysl-2∷GFP by egl-9(n586) mutants. GFP fluorescence micrographs of 5–7 worms aligned side by side carrying the transgene nIs470 [Pcysl-2∷GFP] are shown. Scale bar, 50 μm.
