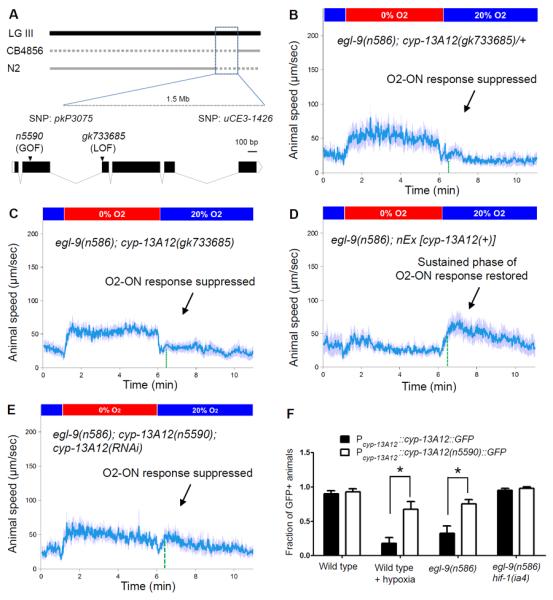
Fig. 2. n5590 is a gain-of-function allele of cyp-13A12.

(A) Genetic mapping positioned n5590 between the SNPs pkP3075 and uCE3-1426. Solid grey lines indicate genomic regions for which recombinants exhibited a defective O2-ON response, thus excluding n5590 from those regions. The locations of n5590 and gk733685 are indicated in the gene diagram of cyp-13A12. (B) Speed graph of egl-9(n586); cyp-13A12(gk733685)/+ animals, showing a defective O2-ON response. (C) Speed graph of egl-9(n586); cyp-13A12(gk733685) mutants, showing a defective O2-ON response. (D) Speed graph of egl-9(n586); nEx [cyp-13A12(+)] animals, showing a restored O2-ON response in the sustained phase (right of the dashed green line). (E) Speed graph of egl-9(n586); cyp-13A12(n5590); cyp-13A12(RNAi) animals, showing a suppressed O2-ON response. (F) Fractions of animals expressing CYP-13A12∷GFP or CYP-13A12(n5590)∷GFP (* p<0.01, two-way ANOVA with Bonferroni's test, n=4).
