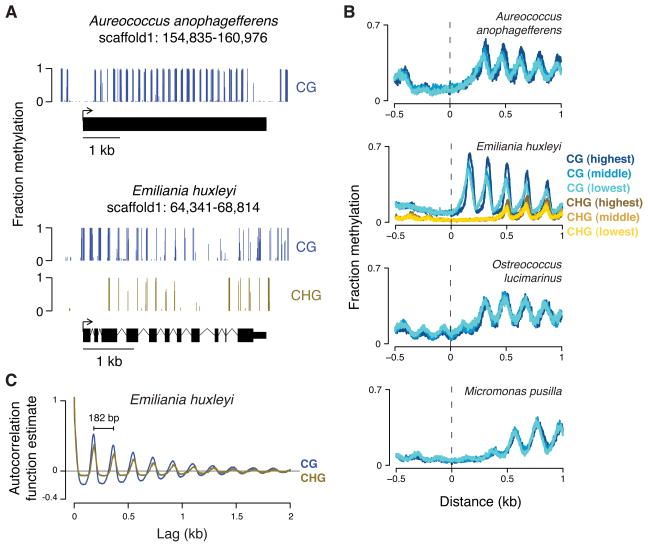
Figure 3. Genomes of diverse species have periodic methylation in gene bodies, regardless of expression levels.
(A) A snapshot of genomic methylation is shown for A. anophagefferens (top) and E. huxleyi (bottom) with each gene model below. (B) We assessed transcription by RNA-seq of total RNA. For each organism, genes were binned into 5 equally sized groups (quintiles) based on expression measured by FPKM (fragments per kilobase of transcript per million mapped reads). The mean methylation at each base pair position aligned to transcription start sites of genes from different quintiles is shown (CG, blue; CHG, gold). Only data for the first (lowest; lightest color), third (middle; middle color), and fifth (highest; darkest color) quintiles are shown for clarity. The average FPKM differences from the lowest to highest quintiles are approximately 100- to 1000-fold, depending on the organism. A similar plot for B. prasinos is in Figure S3A. (C) The autocorrelation function estimate for CG and CHG methylation is shown for each lag (offset) across the largest scaffold of E. huxleyi. The apparent periodicity for both is 182 base pairs (bp). Autocorrelation function estimates for other species are in Figure S3B.

