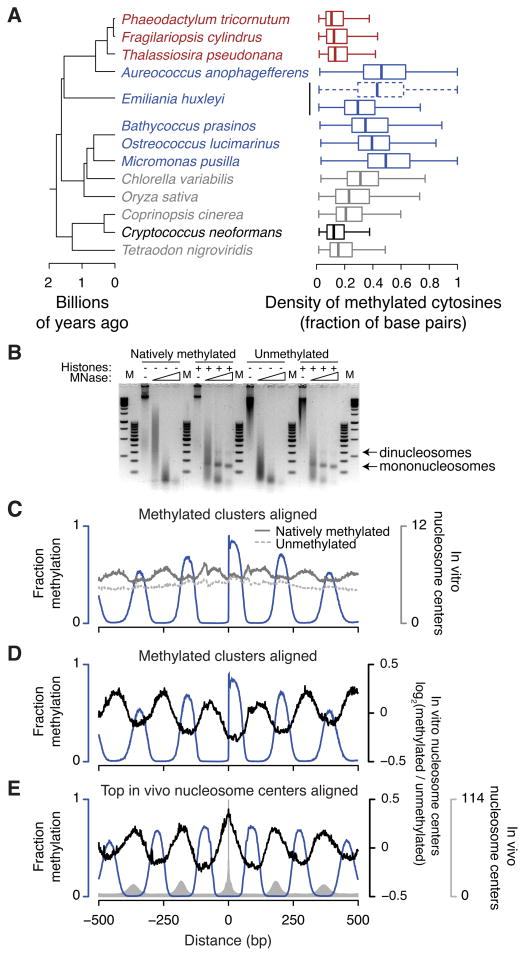
Figure 5. Methylation occurs at unprecedented densities and contributes to nucleosome positioning.
(A) Distributions are shown of the density in each methylated region of base pairs containing methylated cytosines on either strand. For each group in Figure 1B we selected the species with the highest densities of genomic CG methylation (gray) to compare with periodically methylated genomes (blue). Diatoms and C. neoformans are colored red and black, respectively. For E. huxleyi, addition of CHG to CG sites is shown as a dashed box and whiskers. Boxes indicate the medians, first and third quartiles with whiskers indicating the most extreme values up to 1.5 times the interquartile ranges away from the boxes. (B) Digestion with increasing amounts of MNase reveals nucleosomes formed with purified recombinant histones and either natively methylated O. lucimarinus genomic DNA or unmethylated equivalent, generated by in vitro replication. M, 100 bp and 1 kb GeneRuler markers (Thermo). (C–E) Nucleosome positioning data from in vitro assemblies. In panel C the number of reads is shown for nucleosome centers assembled from natively methylated DNA (solid dark gray line) or from unmethylated DNA (dashed light gray line). Panels D and E show the base-2 logarithms of the ratios of reads in the methylated versus unmethylated assemblies (black lines), centered at log2(ratio)=0. In vitro nucleosome centers are aligned to methylation clusters (panels C,D) as in Figure 4C or to the top genomic positions for in vivo nucleosome centers (panel E). The blue lines show fractional CG methylation, and the gray bars in panel E show in vivo nucleosome centers for comparison. See also Figure S5.

