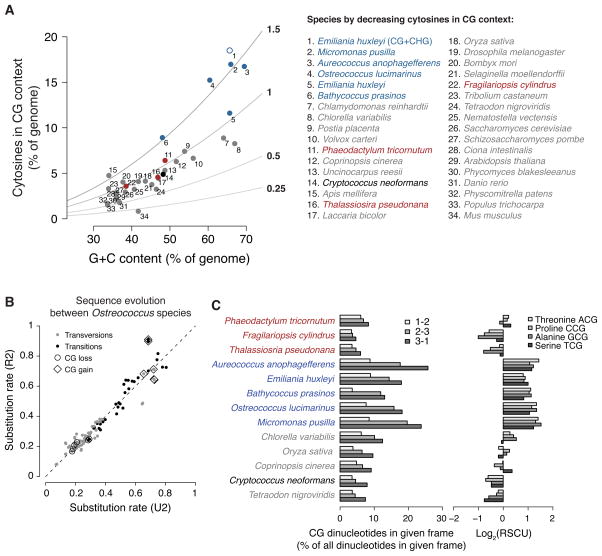
Figure 6. Novel regime of CG-enriching genome evolution.
(A) Cytosines in a CG context as percent of genomic bases versus G+C contents of individual genomes are plotted. The colors are as in Figure 5A, but gray includes most species with published methylation profiles. Observed-to-expected ratios for CG content are shown as lines with values immediately right of the plot. The addition of CHG to CG sites for E. huxleyi (#1) is an open blue circle. The complete legend is at the right. (B) Substitution rates between Ostreococcus species were estimated using either a general reversible (R2) or a general unrestricted (U2) dinucleotide model (Siepel and Haussler, 2004) from the non-coding sequences of aligned chromosomes (Table S2). R2 assumes that sequence evolution is time-reversible, but has the advantage of fewer mathematical parameters to estimate. We show the results of both R2 and U2 models to demonstrate that they generally agree (the dashed line shows the expectation if they had produced identical estimates). Transversions and transitions are colored gray and black, respectively. Substitutions that lose and gain CG sites are labeled with circles and diamonds, respectively. (C) For each of the species in Figure 5A, the frequency of CG dinucleotides as a percent of all dinucleotides in each codon frame (phase) is shown (left). “1–2” represents CG in the first and second positions of codons (lightest fill). These are CGN codons specifying arginine and are somewhat overrepresented in A. anophagefferens, E. huxleyi, O. lucimarinus and M. pusilla. “2–3” represents CG in the second and third positions of codons (medium fill). These codons encode amino acids that can be encoded by other codons. The enrichment of CG in this frame causes codon usage bias, shown by the base-2 logarithms of relative synonomous codon usages (RSCU (Sharp et al., 1986)) for each of the four NCG codons at right (lightest to darkest fill: ACG, CCG, GCG, TCG). High log2(RSCU) values for A. anophagefferens, E. huxleyi, B. prasinos, O. lucimarinus and M. pusilla NCG codons indicate that each of these codons is used to encode its respective amino acid more frequently than if codon usage were unbiased. “3–1” represents CG occurring across neighboring codons (center; darkest fill), which is the only frame in which CG enrichment does not necessarily alter encoded proteins or introduce codon usage bias. See also Figure S6.

