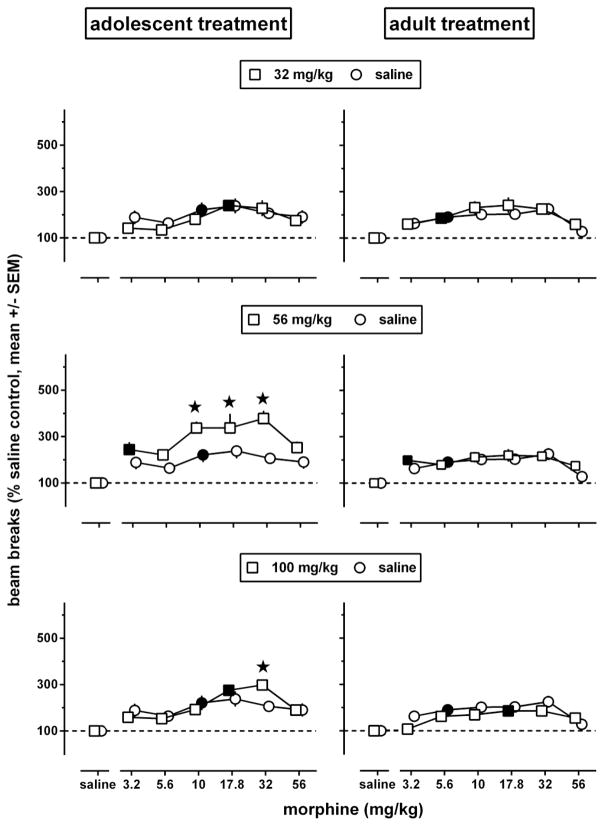
Fig. 5.
Locomotor activity in adult male C57/BL6J mice during a 2h exposure to the activity chambers immediately after an i.p. injection of morphine or its vehicle (n=6 per dose; each animal received only one injection), 5 weeks after repeated administration of saline (circles, re-plotted in each row to facilitate comparisons with repeated administration of morphine) or morphine [squares, one repeatedly administered dose (32–100 mg/kg) per row] while the animals were adolescent (left panels) or adult (right panels). Results are shown as mean (± SEM) values. Error bars that are not shown are contained within the symbol. Data obtained in morphine-treated animals were expressed as a percentage of the data obtained in their corresponding age-matched saline controls. Asterisks indicate p<0.05 of differences between animals repeatedly treated with morphine (squares) or saline (circles), and filled symbols indicate the minimum significant dose (p<0.05) of each dose-response curve.

