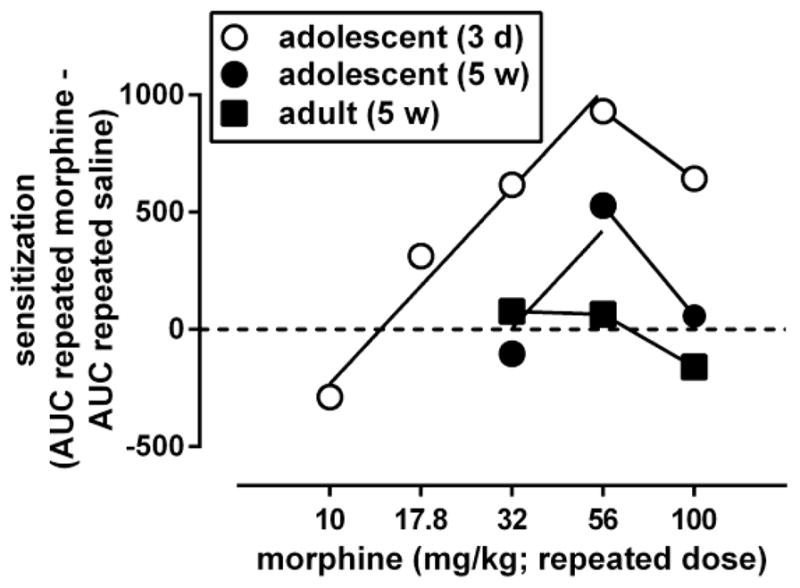
Fig. 6.

Dose-response curves for morphine to induce locomotor sensitization in adult male C57/BL6J mice, 5 weeks after its repeated administration while the animals were adolescent (filled circles) or adult (filled squares). Ordinate: sensitization, measured by the difference between the area under the curve (AUC) for the morphine dose-response curve obtained after repeated treatment with morphine and the morphine dose-response curve obtained after repeated treatment with saline (shown in Fig. 5). Abscissa: dose of morphine that was administered repeatedly. Dose-response data were analyzed by fitting straight lines through the ascending and descending parts of the curves. For comparison, data obtained in adolescents tested 3 days after repeated treatment with morphine (open circles) are re-plotted from Fig. 3.
