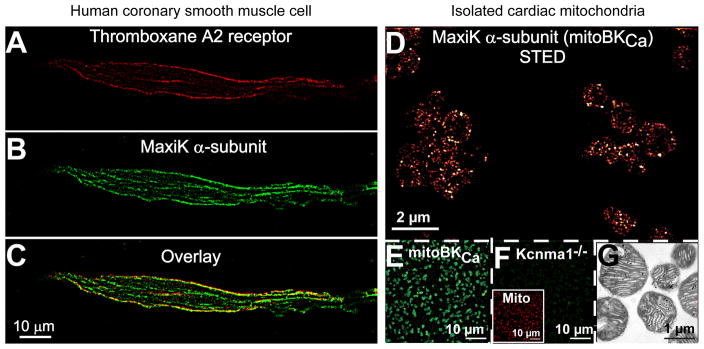
Figure 2. MaxiK α-subunit expression at the plasma membrane in smooth muscle cells and in cardiac mitochondria.

A–C. Freshly dissociated human coronary arterial myocyte double-labeled with anti-MaxiK monoclonal (A) and anti-thromboxane A2 receptor polyclonal (B) antibodies. The overlay (C) shows co-localization of both proteins at the plasma membrane. D. Super-resolution fluorescence images of Percoll-purified cardiac mitochondria [69] labeled for endogenous MaxiK α-subunit (mitoBKCa) with anti-MaxiK polyclonal antibody as described in [68]. Note distinct punctae of mitoBKCa clusters. Images were acquired with a custom-made stimulation emission depletion (STED) microscope and pseudocolored for presentation. E–F. Low resolution confocal fluorescence images of purified mitochondria showing the specificity of the anti-MaxiK antibody (green) with only background signals in mitochondria from the knockout animal (Kcnma1−/−). The inset in F shows the same field double labeled with mitotracker (red). G. Electron micrograph of the purified mitochondria preparation. Images were acquired at 0.0575 μm/pixel in (A–B, E–F) and at 0.0035 μm/pixel in (D), and were median filtered to reduce non-specific background as described earlier [36].
