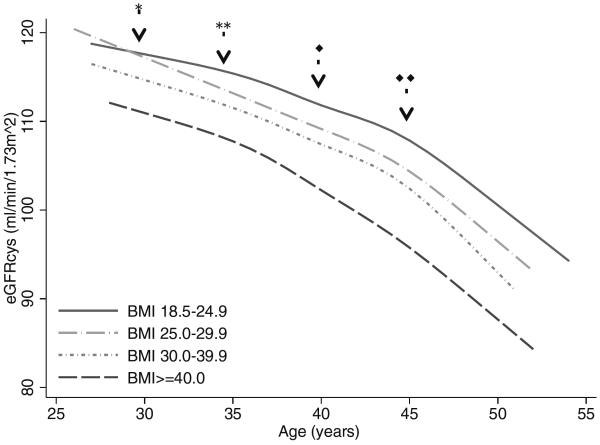
Figure 1.
Trajectory of eGFRcysa declineb by age and BMIa category
a eGFRcys=cystatin C estimated glomerular filtration rate, ml/min/1.73m2, BMI= body mass index, kg/m2
bAdjusted for baseline age, race, sex, hyperlipidemia, smoking status, and physical activity.
*Difference in eGFRcys slope BMI 25.0–29.9 vs. BMI 18.5–24.9, p=0.01
**Difference in eGFRcys slope BMI 25.0–29.9 vs. BMI 18.5–24.9, p=0.002
◆Difference in eGFRcys slope BMI ≥40 vs. BMI 18.5–24.9, p=0.02
◆◆Difference in eGFRcys slope BMI 30.0–39.9 vs. BMI 18.5–24.9, p=0.002

