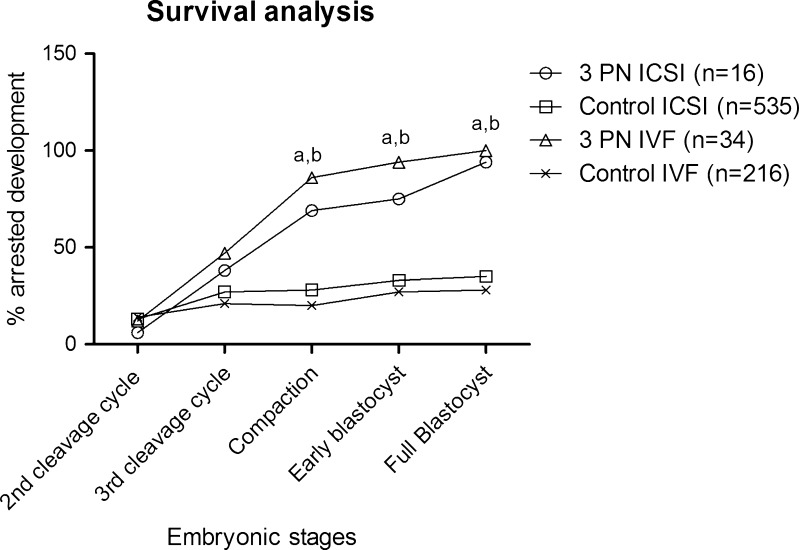
Fig. 2.
Survival analysis of 3PN IVF or ICSI compared to their respective 2PN controls. Fisher’s exact test was used to test the hypothesis of no difference between the 3 PN and 2 PN groups. Significant differences (p < 0.05) between 3 PN embryos and the 2 PN embryos are marked with a for the IVF embryos and b for the ICSI embryos, respectively

