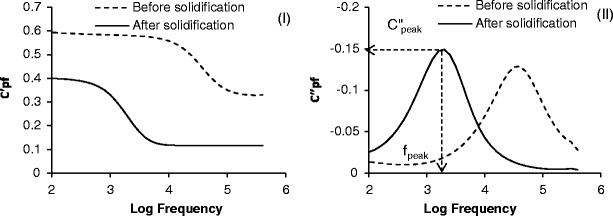
Fig. 2.

Capacitance plots during the freezing of a sucrose solution (30 mg/mL): i left shows the frequency dependence of the real part of capacitance (C′) and ii right shows the frequency dependence of the imaginary part of capacitance (C′). The dotted line represents liquid state and the solid line denotes frozen state
