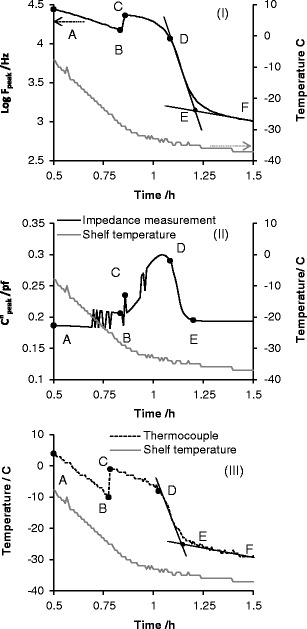
Fig. 3.

Time profile of i the peak frequency (f peak), ii the peak amplitude (C″ peak) and iii product temperature of sucrose 30 mg/mL during freezing. Plots I and III clearly identify critical steps relating to product freezing; A to B is product cooling (pre-ice formation), B is the onset of ice formation, C describes the maximum increase in product temperature following exothermic heat dissipation during ice formation. From these transitions, one can define B–D as the ice solidification phase, D–E as the equilibration phase, E–F is product cooling (ii; post-ice formation). C″ peak appears noisy during the freezing but delineates precisely the end point of the equilibration phase (point E). Note that time zero is taken from the end of the equilibration phase after the vial and contents have been maintained at 25°C for 10 min
