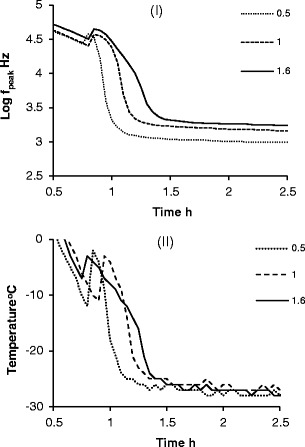
Fig. 4.

Time profiles of i f peak and ii temperature for 30 mg/mL sucrose during freezing at different fill factors (Φ = 0.5, 1 and 1.6; n = 10). Note that time zero is taken from the end of the equilibration phase after the vial and contents have been equilibrated at 25°C for 10 min
