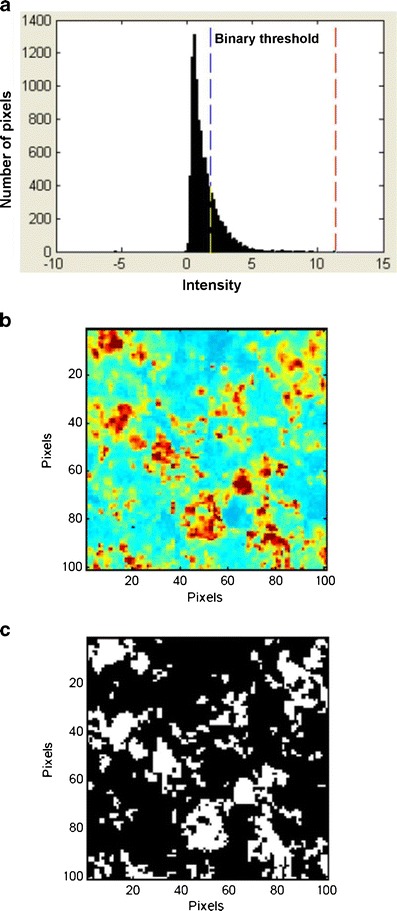
Fig. 11.

Binarization of Ebastel tablet cross-section. a Intensity histogram at 1,601 cm−1 after preprocessing. Red and blue dashed lines indicate the maximum and threshold intensity, respectively. b Raman chemical image of Ebastel tablet cross-section at 1,601 cm−1 after preprocessing. c Binary image of ebastine
