Fig. 3.

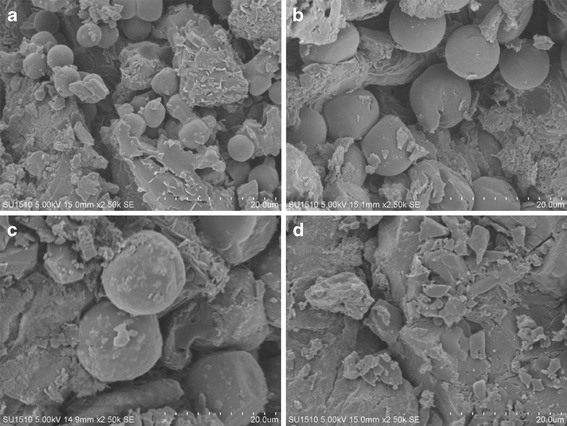
SEM micrographs of tablet cross-sections. Tablet containing a 5 μm, b 10 μm, and c 15 μm PS microspheres, and d ebastine (Ebastel tablet). Scale bar 20 μm

SEM micrographs of tablet cross-sections. Tablet containing a 5 μm, b 10 μm, and c 15 μm PS microspheres, and d ebastine (Ebastel tablet). Scale bar 20 μm