Fig. 5.

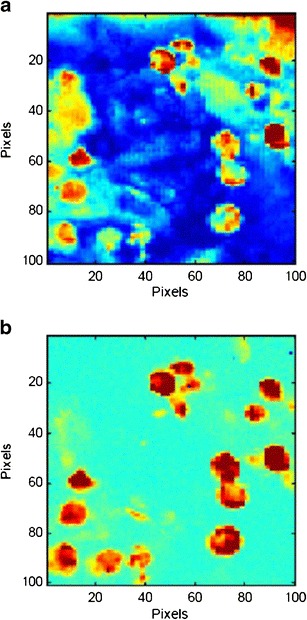
Raman chemical images of cross-section of model tablet (10 μm PS microspheres). Raman chemical images at 1,605 cm−1 a prior to preprocessing and b after preprocessing

Raman chemical images of cross-section of model tablet (10 μm PS microspheres). Raman chemical images at 1,605 cm−1 a prior to preprocessing and b after preprocessing