
FIGURE 5.
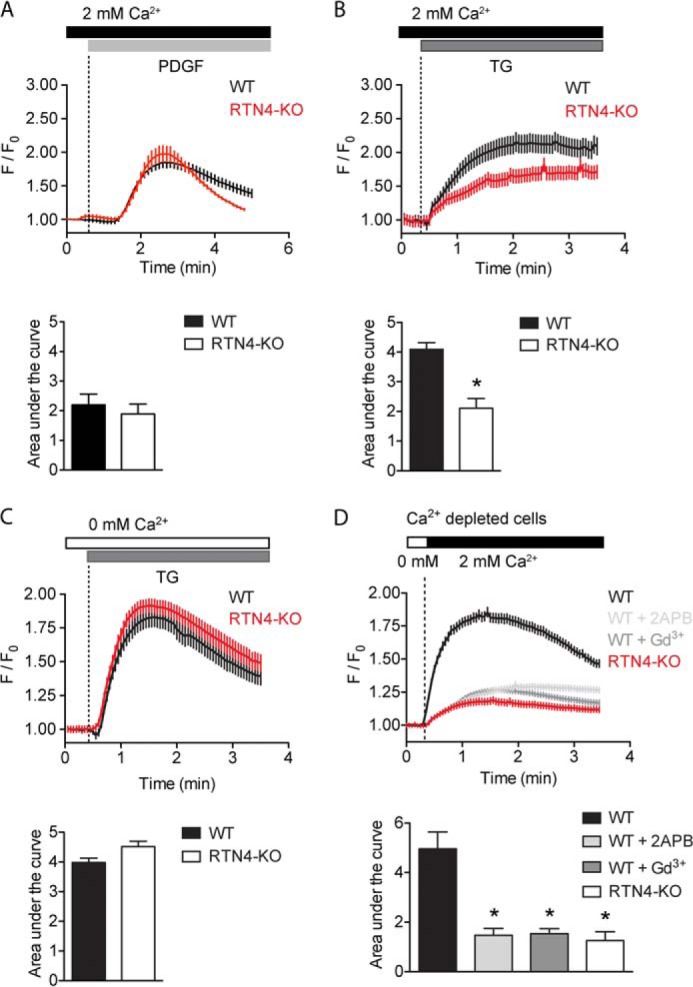
Loss of RTN4a/b reduces SOCE. A and B, increase in cytosolic Ca2+ in response to 10 ng/ml PDGF (A) or 1 μm TG (B) in WT and RTN4-KO MEFs in the presence of extracellular Ca2+. C, increase in cytosolic Ca2+ in response to TG induced depletion of internal stores in the absence of extracellular Ca2+. D, SOCE assessed by re-addition of extracellular Ca2+ to stores-depleted cells. Inhibition of SOCE was carried out in WT MEFs exposed to vehicle or CRAC inhibitors 2APB (50 μm) or gadolinium (10 μm). A–D, calcium traces represent the average response of 25–30 cells per triplicate from a single experiment. F/F0, change in fluorescence intensity relative to baseline. Areas under the curve were calculated after treatment or re-addition of external Ca2+. Data represent the mean ± S.E. of 4–6 independent experiments. *, p < 0.05 compared with WT MEFs, Student's t test.