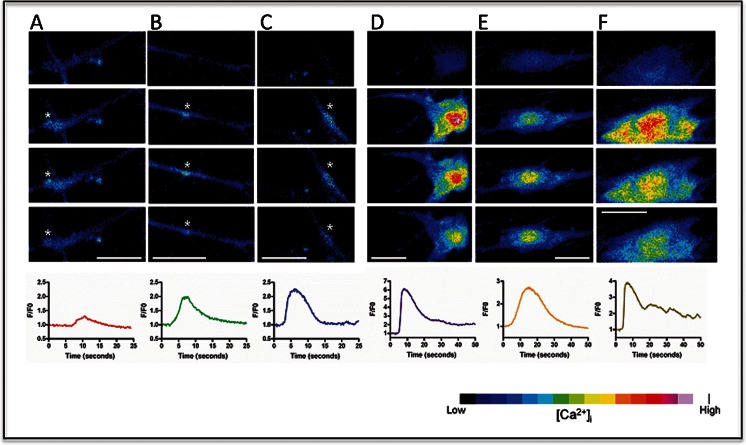
Fig. 6.
Spontaneous and agonist-mediated calcium responses. Spontaneous elevations of calcium were evident in the majority of cells and are indicated by the white asterisks of three cells depicted in panels a–c. The frames are 2.5 s apart. Purinergic-mediated calcium responses took the form of spatially propagated waves as depicted in three cells depicted in panels d–f. The frames are 2.5 s apart. The lineplots at the bottom of panels a–f illustrate the F/F0 for time periods of 25 s or 50 s for spontaneous (a–c) or agonist (d–f) changes respectively. Bars, 10 μm

