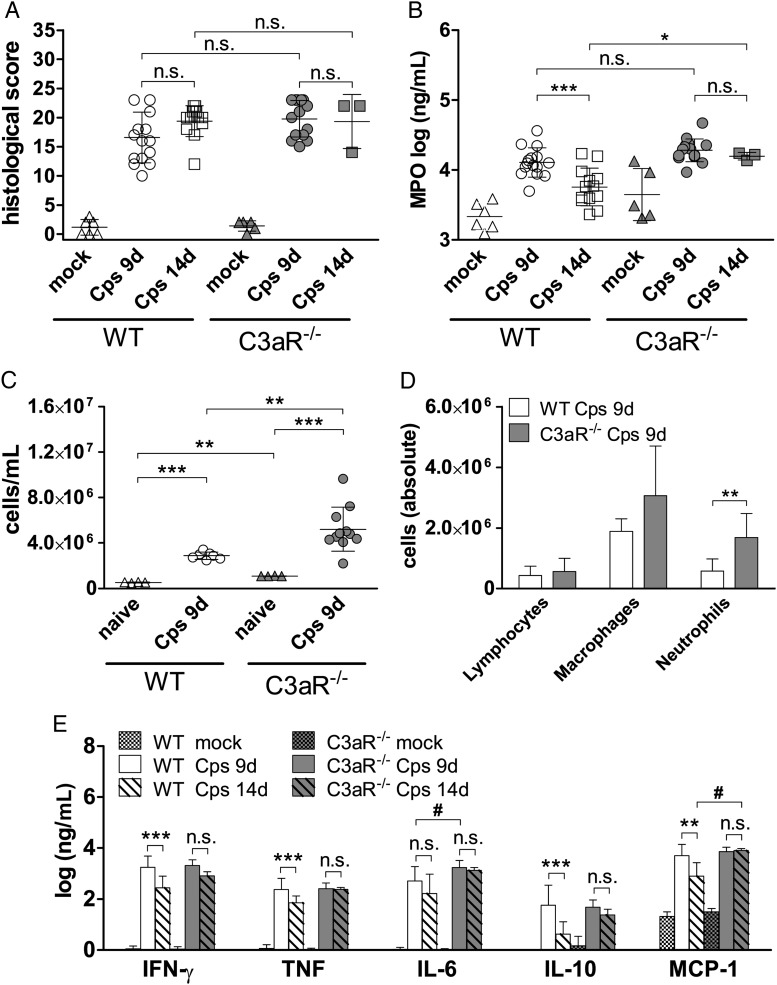
Figure 3.
Lung histopathology, granulocyte marker myeloperoxidase, cytokine levels in lung homogenates, and cell analyses in BALF. A, Histopathological score in lung. Mock-treated mice showed only a minimal inflammatory score. Degree of lung inflammation was scored in H&E-stained sections based on hemorrhaging, inflammatory cells, affected area, edema, peribronchiolar infiltrates, luminal exudates, and overall disease pathology score. Mouse lung pathology was determined by adding all of the points, resulting in a score of 0 (not affected) to 26 (highly affected) points. Since granulocytes can only influence 7 of 26 points of the general histological score, these cells were assessed in more detail applying measurements of their marker enzyme MPO (B). Levels of mock-treated mice were significantly lower than levels of corresponding C. psittaci-infected animals. C, Cell counts (diameter 4–18 µm) in BALF of naïve and infected mice. D, Cellular distribution in BALF of infected mice. The group size for data on WT mice depicted in (C) and (D) was: naïve n = 4; 9 d p.i. n = 7, and on C3aR−/− mice: naïve n = 4; 9 d p.i. n = 11. E, Cytokine levels of WT and C3aR−/− mice. Levels of mock-treated mice were significantly lower than levels of corresponding C. psittaci-infected animals. In addition to differences indicated by asterisks, levels of monocyte chemotactic protein-1 (MCP-1) on day 14 p.i. and of IL-6 on day 9 p.i. were significantly higher in C3aR−/− compared to WT mice (indicated by # P ≤ .05). IL12p70 was below the limit of detection and is not depicted. The group size for measurements on WT mice depicted in (A), (B), and (E) was: mock n = 6; 9 d p.i. n = 15; 14 d p.i. n = 13, and on C3aR−/− mice: mock n = 5; 9 d p.i. n ≥ 14; 14 d p.i. n = 3. Data depicted in panels (A) and (E) were statistically analyzed with Kruskal-Wallis test followed by Dunn multiple comparison test. Data in (B) and (C) were analyzed with 1-way ANOVA and Tukey multiple comparison test. Data depicted in (D) were analyzed with 2-way ANOVA and Bonferroni Posttest after logarithmic transformation. Means ± SD are depicted. Asterisks indicate significant differences between infected WT and C3aR−/−, the different time points, and between naïve and infected mice (*P ≤ .05; **P ≤ .01; ***P ≤ .001; n.s. = not significant). Abbreviations: ANOVA, analysis of variance; BALF, broncho-alveolar lavage fluid; C3aR, C3a receptor; d p.i., days postinfection; IL, interleukin; MPO, myeloperoxidase; SD, standard deviation; WT, wild type.

