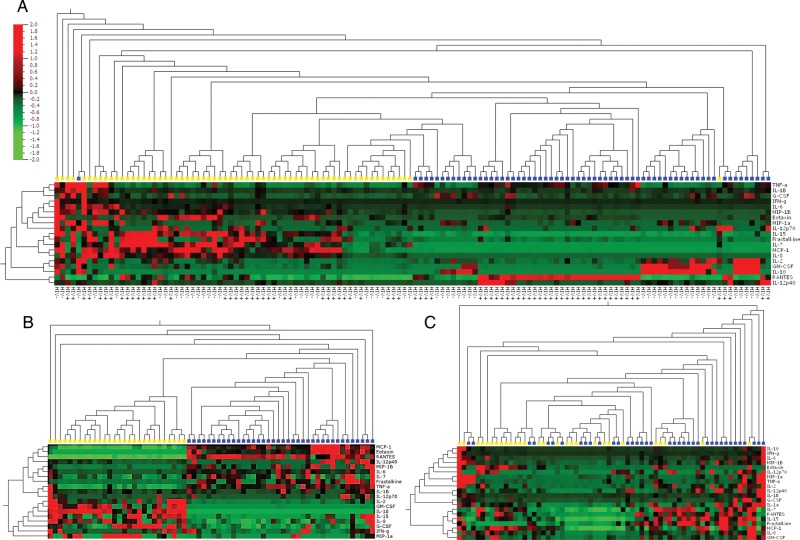
Figure 1.
Two-way unsupervised hierarchical clustering of cytokine concentrations present in semen and blood. A, Heat map showing a cluster analysis of cytokines in all men (n = 66); yellow blocks represent semen and blue blocks represent blood. B, Heat map showing a cluster analysis of cytokines in blood and semen (C); yellow blocks represent HIV− men and blue blocks represent HIV+ men. The analysis was performed using Qlucore Omics Explorer software. Cytokine levels are expressed as color scales using normalized values for each cytokine and depicted according to a color scale, where red represents high concentrations and green represents low concentrations. Dendograms above classify the samples according to human immunodeficiency virus status and dendrograms on the left side reflect proximities of cytokines to each other. Abbreviations: G-CSF, granulocyte colony-stimulating factor; GM-CSF, granulocyte macrophage colony-stimulating factor; HIV, human immunodeficiency virus; IFN, interferon; IL, interleukin; MCP, monocyte chemotactic protein; MIP, macrophage inflammatory protein; RANTES, regulated upon activation normal T cell expressed and secreted; TNF, tumor necrosis factor.

